Download
1 / 70
700 likes | 829 Views
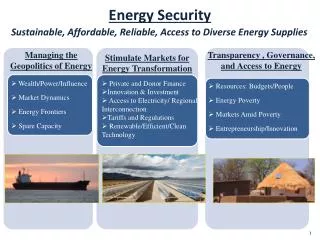
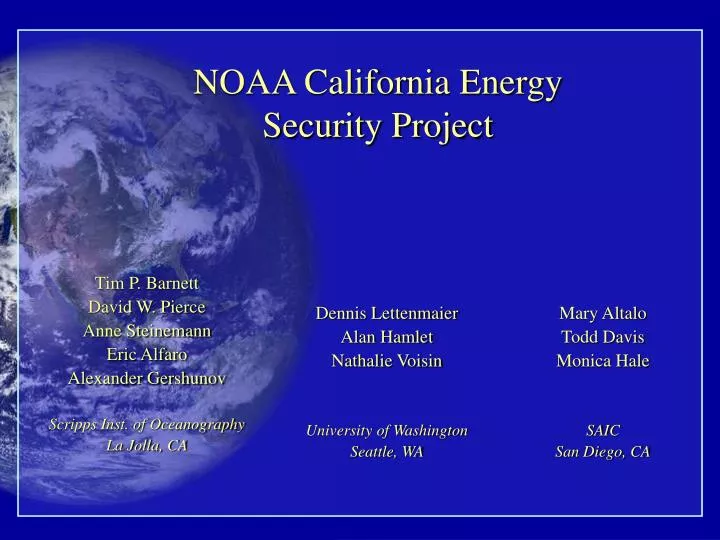
NOAA California Energy Security Project. Dennis Lettenmaier Alan Hamlet Nathalie Voisin University of Washington Seattle, WA. Mary Altalo Todd Davis Monica Hale SAIC San Diego, CA. Tim P. Barnett David W. Pierce Anne Steinemann Eric Alfaro Alexander Gershunov

E N D
NOAA California Energy Security Project Dennis Lettenmaier Alan Hamlet Nathalie Voisin University of Washington Seattle, WA Mary Altalo Todd Davis Monica Hale SAIC San Diego, CA Tim P. Barnett David W. Pierce Anne Steinemann Eric Alfaro Alexander Gershunov Scripps Inst. of Oceanography La Jolla, CA
Project Overview Scripps Inst. Oceanography University of Washington Georgia Inst. Tech Academia California Energy Commission California ISO PacifiCorp San Diego Gas & Elec. SAIC State Partners Industrial Partners
Project Objective Determine the economic value of climate and weather forecasts to the energy sector
Why aren’t climate forecasts used? • Climate forecasts are probabilistic in nature – sometimes unfamiliar to the user • Lack of understanding of climate forecasts and their benefits • Language and format of climate forecasts is hard to understand – need to be translated for end-users • Aversion to change – easier to do things the traditional way
Importance of Stakeholder Involvement • Identify potential uses and benefits of forecast information • Develop forecasts to meet user needs • Deliver and discuss products with stakeholders • Obtain feedback from stakeholders and iterate • Integrate forecasts with decision-making
Key stakeholder questions • What types of forecast information could help with decision-making? • What are the specifications for desired forecasts? • What are the organizational incentives and barriers to forecast use? • What are the potential benefits and costs of using the forecast information?
Case studies • California delta breeze • Peak day load forecasting • Irrigation pump loads • California summer temperatures • Hydropower
1. California "Delta Breeze" • An important source of forecast load error (CalISO) • Big events can change load by 500 MW (>1% of total) • Direct cost of this power: $250K/breeze day (~40 days/year: ~$10M/year) • Indirect costs: pushing stressed system past capacity when forecast is missed!
NO delta Breeze Sep 25, 2002: No delta breeze; winds carrying hot air down California Central valley. Power consumption high.
Delta Breeze Sep 26, 2002: Delta breeze starts up; power consumption drops >500 MW compared to the day before!
Weather forecasts of Delta Breeze 1-day ahead prediction of delta breeze wind speed from ensemble average of NCEP MRF, vs observed.
Statistical forecast of Delta Breeze (Also uses large-scale weather information) By 7am, can make a determination with >95% certainty, 50% of the time
Dennis Gaushell, Cal-ISO <- Warmer than forecast Colder than forecast ->
Delta Breeze summary • Using climate information can do better than dynamic weather forecasts • Possible savings of 10 to 20% in costs due to weather forecast error. Depending on size of utility, will be in range of high 100,000s to low millions of dollars/year.
2. Load demand management • Induce customers to reduce electrical load on peak electrical load days • Prediction challenge: call those 12 days, 3 days in advance • Amounts to calling weekdays with greatest "heat index" (temperature/humidity)
Why shave peak days? http://www.energy.ca.gov/electricity/wepr/2000-07/index.html
Price vs. Demand http://www.energy.ca.gov/electricity/wepr/1999-08/index.html
July Average = 2916 MW
July Average = 2916 MW Top days = 3383 MW (16 % more than avg)
Peak day electrical load savings • If knew electrical loads in advance: 16% • With event constraints: 14% (Load is relative to an average summer afternoon)
July Average = 2916 MW
July Average = 2916 MW Warm days = 3237 MW (11 % more than avg)
Peak day electrical load savings • If knew electrical loads in advance: 16% • With event constraints: 14% • If knew temperature in advance: 11% (Load is relative to an average summer afternoon)
Peak day electrical load savings • If knew electrical loads in advance: 16% • With event constraints: 14% • If knew temperature in advance: 11% • Super simple scheme (24C, 0.5): 6% (Load is relative to an average summer afternoon)
Peak day summary • Might ultimately be a real-time program • Driven by "smart" electric meters • Main benefit would be avoided cost of peaker generation plants ~$12M/yr. • Until then, climate prediction: • Far less deployment cost • Cost of avoided procurement ~$1.3M/yr -> Climate analysis can give expected benefits to a program
3. Irrigation pump loads • Electricity use in Pacific Northwest strongly driven by irrigation pumps • When will the pumps start? • What will total seasonal use be?
Irrigation pump start date Idaho Falls, ID
Total use over summer Idaho Falls, ID
Irrigation load summary • Buying power contracts 2 months ahead of a high-load summer saves $25/MWh (over spot market price) • Use: about 100,000 MWh • Benefit of 2 month lead time summer load forecast: $2.5 M
Why the NPO matters Higher than usual pressure associated with the NPO… generates anomalous winds from the north west… …which bring more cold, arctic air into the western U.S. during winter
NPO and heating degree days Positive NPO Negative NPO Difference is about 150 HDD, or 5% of total HDD
Summer forecast objectives • Develop forecasts of interest to the CEC • Focus on: extreme events, strings of hot days, CDD • Technique: use an advanced statistical approach (Canonical Correlation Analysis)
Extreme events Same temperature threshold (e.g. 95 °F) => Same percentile threshold (e.g. 95th) =>
Spring SST predicting summer temperatures CDD Tmax-95th percentile
Relationship PDO => California Summertime Temperatures Correlations, Mode 1-PSST, MAM Correlations, Mode 1-Tmean, JJA =>
Contingency Analysis (conditional probabilities): = 0.01 => ***, 0.05 => **, 0.10 => *
Pacific SST & CA temperatures summary • Spring Pacific sea surface temperatures predict summer temperature in California • Above normal PDO is associated with warm CA summers (and below normal PDO with cold summers) • Possible uses of this information include risk reduction, and improved planning and reliability
5. Precipitation, Runoff, and Hydropower • Work done by U.W. hydrology group (Dennis Lettenmaier, Alan Hamlet, Nathalie Voisin) • How much does hydropower production vary given realistic climate fluctuations? • What are the regional implications?
Step 1: Develop climate forcing fields • Raw station data is biased because stations mostly at low altitude, but streamflow influenced by high-altitude precipitation • Can correct for altitude effects • Period: 1916-2002