Download
1 / 13
130 likes | 278 Views
Local Hot Bubble Science Does it Exist?. Steve Snowden NASA/GSFC. What makes up the soft X-ray background?. From Near to Far: Geocoronal emission from scattered solar X-rays and solar wind charge exchange, and auroral X-rays Heliospheric solar wind charge exchange (SWCX) emission

E N D
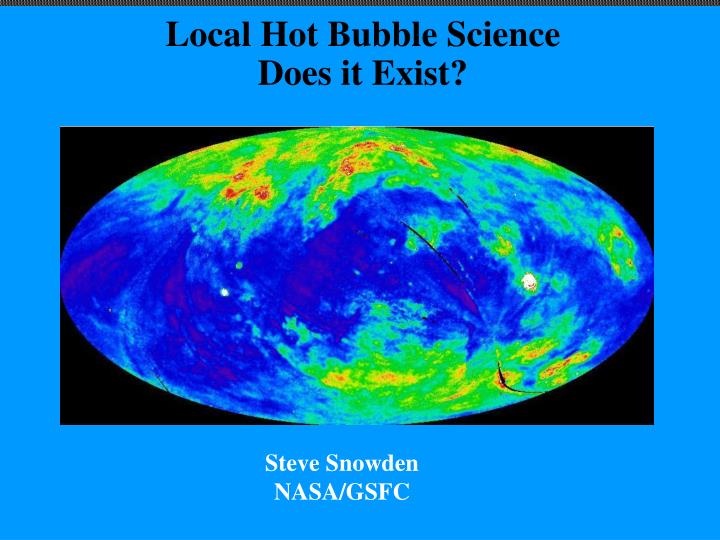
Local Hot Bubble ScienceDoes it Exist? Steve Snowden NASA/GSFC
What makes up the soft X-ray background? • From Near to Far: • Geocoronal emission from scattered solar X-rays and solar wind charge exchange, and auroral X-rays • Heliospheric solar wind charge exchange (SWCX) emission • Local Hot Bubble (LHB) • Nearby supernova remnants (SNRs) and superbubbles (SBs) • More distant SNRs and SBs • Stars (unresolved so “diffuse”) • Galactic Bulge • Galactic Ridge • Galactic Halo, part 1 (cooler) • Galactic Halo, part 2 (hotter) • Local Group • Extragalactic power law (unresolved AGN and so also “diffuse”) • Clusters and structure of the Universe • Nearly all diffuse emission is thermal in origin, and therefore dominated by line emission. RASS ¼ keV Band RASS ¾ keV Band
The ¼ keV Background The ¼ keV diffuse background was first observed in the late 1960’s using sounding rocket data. During the 1970’s and early 1980’s the sky was mapped using both sounding rockets and satellite observatories. All maps agreed quite well and showed a distinct negative correlation between the ¼ keV background and the column density of Galactic material. Mapping culminated in the 1990’s with the ROSAT All-Sky Survey and the IRAS 100 mm data. The negative correlation was first interpreted as an extragalactic background absorbed by Galactic material. Next it was realized that there was a real background in the Galactic plane, and that due to the short MFP at ¼ keV it had to originate locally IRAS 100 mm RASS ¼ keV
The Local Hot Bubble This led to the concept of the Local Hot Bubble Local - meaning surrounding the Sun with an extent of ~50 to ~150 pc Hot - meaning T~0.1 keV Bubble - meaning there isn’t much else within the bubble except for the hot plasma and a few partially ionized clouds (e.g.,the Local Fluff) 21 cm observations ISM absorption line studies No significant communication with Loop I (different temperatures) Emission appears to be bounded Supernova origin (deep sea floor sediment, OB association movement through the ISM) In the late 1980’s it was suggested that nearly all of the ¼ keV background could be produced by the LHB. This model was “Not inconsistent with any of the available data” (Dan McCammon). This was actually a step forward. But the RASS changed all that, and the Galaxy got a whole lot more complicated.
Nearby Supernova Remnants and Superbubbles North Polar Spur/Loop I Vela/Puppis SNRs Monogem SNR Cygnus Superbubble Eridanus Superbubble Cygnus Loop Galactic Bulge LMC RASS ¼ keV Band
Cartoon of the ISM Thesolar neighborhood. The locations and extents of the various objects have come from a variety of sources.
Solar System Emission SWCX emission occurs when highly ionized solar wind particles charge exchange with either exospheric or ISM material. Carbon, oxygen, neon, and magnesium emission is common. The SWCX is both distributed throughout the solar system and associated with Earth’s magnetosheath. There is, perhaps, additional emission at the heliopause. Strongly time variable O VII and O VIII emission is particularly problematic for astrophysical observations. Most striping from SWCX XMM-Newton SWCX emission spectrum
Solar System Emission SWCX emission can also be problematic to detect with relatively constant fluxes over extended periods (tens of ks). Multiple observations of the same direction can give some idea of the level of contamination. Abnormally strong O VII, O VIII, and Mg XI can also suggest the presence of SWCX emission But, space astronomy folks actually care about SWCX emission as it can possibly provide remote sensing on phenomena which currently rely upon in-situ measurements. XMM-Newton SWCX emission and associated light curves
Suzaku SWCX emission is relatively common Expected from the RASS LTEs However, we can only easily identify the brighter episodes => What is the zero level of SWCX emission Currently we are only able to observe at E>0.5 keV => Not in general the same spectrum as the LHB
Pros and Cons • LHB • Pro • Explains many observational issues well • Negative correlation between the ¼ keV intensity and HI column density • Lack of spectral hardness variation with intensity • Con • Requires a high thermal pressure inconsistent with local ISM • SWCX • Pro • We know it exists, it has to contribute some to the observed flux • Models seem to predict the observed amount of O VII and O VIII emission • Con • Good agreement between surveys with radically different geometries • SWCX cross sections uncertain at lower energies • Odd geometry at higher latitudes, two separate emission regions
ROSAT Spectra The ROSAT All-Sky Survey gave us the best available view of the ¼ keV diffuse background. It used a proportional counter and so Had very poor spectral resolution.
LHB EmissionModel vs Observed Model Spectrum DXS Spectrum The observed spectrum (DXS) is dominated by line emission. The spectrum, though, is completely different from what has been used for modeling. The spectrum is not from a thermal equilibrium spectrum, strange abundances and non-equilibrium ionization states.
SWCX EmissionModel vs Observed DXS Spectrum Model SWCX DXS Data vs. Model SWCX Emission Not many similarities here either