Download
1 / 17
170 likes | 264 Views
Il toolbox Snag per la simulazione e l'analisi dei dati gravitazionali Sergio Frasca. Gd class. ds class. function d=ds(a) %DS ds (data stream) class constructor % % d=ds(a) -> a is the length % % Data members % % tini1 time of the first sample of y1

E N D
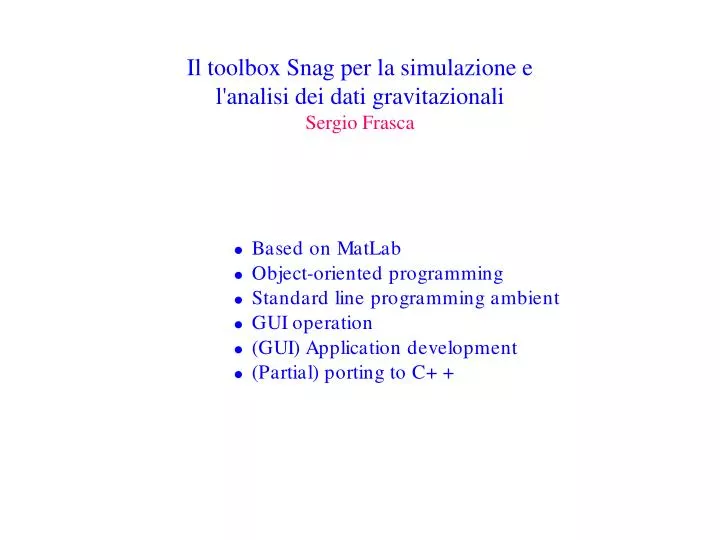
Il toolbox Snag per la simulazione e l'analisi dei dati gravitazionaliSergio Frasca
ds class • function d=ds(a) • %DS ds (data stream) class constructor • % • % d=ds(a) -> a is the length • % • % Data members • % • % tini1 time of the first sample of y1 • % tini2 time of the first sample of y2 • % dt sampling time • % len length of chunks • % y1 odd chunk (last chunk if not interlaced) • % y2 even chunk (last but one chunk if not interlaced) • % ind1 index of y1 • % ind2 index of y2 • % type type (=0 -> not interlaced no last but one, • % =1 -> not interlaced, =2 -> interlaced) • % nc1 number of y1 chunk • % nc2 number of y2 chunk • % lcw last chunk written ("produced") • % lcr last chunk read ("served" - for client-server use) • % treq time requested (to start) • % capt caption • % cont control variable
Snag commands • % Snag commands • % • % snag - snag command/monitor window; see Snag_ML.doc • % • % General analysis: • % • % da_plot - plots double arrays • % da_stat - statistics for double array • % histoint - integral histogram of an array • % gd_histoint - integral histogram of a gd • % gd_plot - plots gds • % gd_cplot - plots for complex gds • % gd_stat - statistics of gds • % ginproc - graphical input processing (used by ginmenu) • % • % Analysis (in \analysis): • % • % analysis\gd_acorfft - fft autocorrelation or autocovariance • % analysis\gd_crcorfft - fft cross-correlation or cross-covariance • % analysis\atan3 - atan3 • % analysis\gd_pows - power spectrum • % analysis\gd_worm - worm analysis • % analysis\gd_hilb - analytical signal • % • % Processing: • % • % gd_smooth - smooths a gd • % gd_play - "plays" a gd
Matlab functions summary • % Snag commands • % • % snag - snag command/monitor window; see Snag_ML.doc • % • % General analysis: Graphics and statistics • % Analysis (in \analysis): Signal analysis • % Processing: Basic processing • % Settings: Particular GD settings • % Service: Service functions (ui, gin and basic tasks) • % Special m-files: Service functions (ui, gin and basic tasks) • % Demos Demo m-files • % Gravitational Waves (in \gw) GW functions • % Frames analysis Frame analysis • % Class gd (group of data) gd class methods • % Class gd2 (group of data - two dimension) gd2 class methods • % Class ds (data stream) gd class methods • % Class rs (resonance set) gd class methods • % Class rg (ring structure) gd class methods