Download
1 / 19
200 likes | 517 Views
POPULATION CHANGE. Learning Outcomes: To be able to describe the change in global population numbers over the past 2000 years To be able to describe differences between population change in HICs and LICs/MICs. KEY FACTS. On 12 th October 1999 the world’s population reached 6 billion

E N D
POPULATION CHANGE Learning Outcomes: To be able to describe the change in global population numbers over the past 2000 years To be able to describe differences between population change in HICs and LICs/MICs
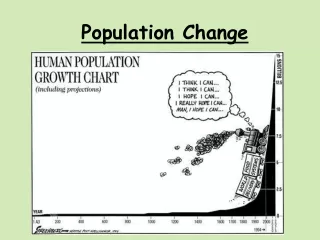
KEY FACTS • On 12th October 1999 the world’s population reached 6 billion • 2000 years ago population was only 350 million – 1900’s when population began to rise quickly • In 1970 main growth areas were Europe, North America and South America - Highest population was in Asia • Really rapid growth period between 1950 and 2000 http://www.poodwaddle.com/clocks/worldclock/
Global population since 1750 Task 1 Using page 229 in the textbook annotate on your graph at least 7 key dates in time regarding global population change
POPULATION GROWTH Describe how the world’s population changed between 1750 and 2000 (3 marks) Challenge: How does the graph predict population will change in the future? Why? at what rate? (4 marks)
The proportion of the world’s population in LICs and HICs 1990 30% HIC 20% HIC 70% LIC/MIC 80% LIC/MIC 10% HIC 90% LIC/MIC Using the information provided describe how the proportion of the world’s population has changed in LICs and HICs (4 marks)
Describe how you think population will change in the future, why?
POPULATION GROWTH AND DISTRIBUTION Learning Outcomes: To be able to describe the distribution of global population- sparsely/densely populated areas To know human and physical factors for this distribution Challenge: To be able to explain this distribution in terms of human and physical factors
Video • Watch the following video clip and answer the following : • 2 reasons why people chose to live where they do • 2 reasons why do not live in certain areas • Examples of such areas
What do the following key terms mean? With your partner discuss the meaning of the following: • Population distribution • Population density Challenge: write 2-3 questions that could be asked in an exam based on these two key terms?
The distribution of global population What do you think the global population distribution is like? Colour code which statements relate to densely/ sparsely populated areas- remember to include a key!!
Extension: Complete the paragraph Population …………… means the pattern of where people live. World population is …………. Places which are …………… populated have fewer people. Places that are …………… populated contain …………….. people. These are usually places with ……………… environments, for example Antarctica. Places that are populated are habitable environment, such as ………………. Sparsely, densely, distribution, Europe, uneven, hostile, many
Complete the paragraph Population DISTRIBUTION means the pattern of where people live. World population is UNEVEN. Places which are SPARSELY populated have fewer people. Places that are DENSELY populated contain MANYpeople. These are usually places with HOSTILE environments, for example Antarctica. Places that are densely populated are habitable environment, such as EUROPE.
Homework • http://www.poodwaddle.com/health/lifeclock/ • Complete the online activity- which estimates your life expectancy based on your lifestyle and location • Print out/ write down life expectancy and bring to next lesson
World Population Map WHAT DOES THIS MAP REPRESENT???
Starter • State 2 human and 2 physical reasons for places being sparsely populated. Give examples. • State 2 human and 2 physical reasons for places being densely populated. Give examples.
Birth & Death rates • Draw a set of scales to indicate: • Population increase • Population decrease • Steady population
Causes of change • Annotate on the images the causes of change in birth and death rates. • Include SLD!!!! • Extension: P236 complete questions 1 and 2
4 5 3 1 2 Race Time
A Winner B C D SNAIL A SNAIL B SNAIL C SNAIL D