Download
1 / 22
220 likes | 303 Views
Systems Engineering in DC (SEDC) 2014 Conference and Exhibition Session: Decision Making Chaired by: Don Gelosh.

E N D
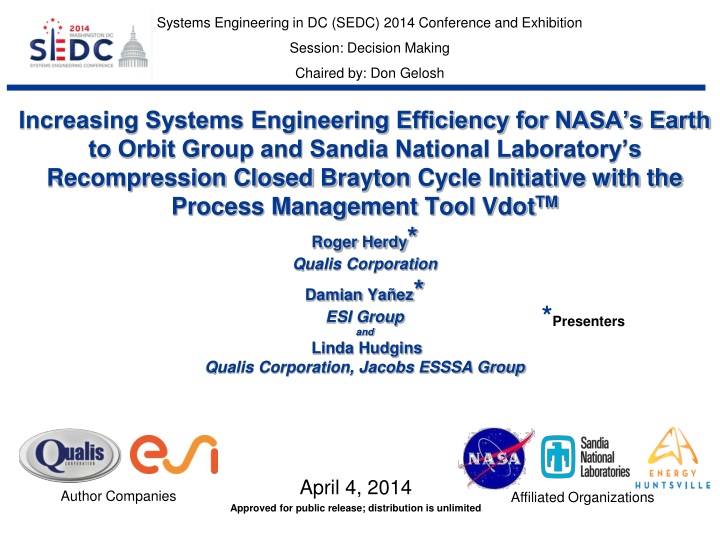
Systems Engineering in DC (SEDC) 2014 Conference and Exhibition Session: Decision Making Chaired by: Don Gelosh Increasing Systems Engineering Efficiency for NASA’s Earth to Orbit Group and Sandia National Laboratory’s Recompression Closed Brayton Cycle Initiative with the Process Management Tool VdotTMRoger Herdy*Qualis Corporation Damian Yañez*ESI Groupand Linda HudginsQualis Corporation, Jacobs ESSSA Group *Presenters April 4, 2014 Approved for public release; distribution is unlimited
Agenda • Introduction • Process Management With Vdot™ • NASA’s Earth to Orbit (ETO) Architecture Analysis • Managing the ETO Architecture Analysis • Sandia National Laboratory’s Recompression Closed Brayton Cycle Development and Commercialization • Managing the Supercritical Transformational Energy Power (STEP) Initiative • Conclusions • Acknowledgements
Introduction • American engineer and social scientist Henry Laurence Gantt was the inventor of the Gantt chart, the most common form of showing a project plan and progress. • The PERT (Program Evaluation and Review Technique) chart, conversely, is a pure logic representation of the project, with no time scaling, but with detailed logic relationships. Originally developed by the US Navy in the 1950s. • However, most planning and execution software tools do not supply a real-time, critical path analysis, or the ability for the manager to quickly see a broad picture.
Introduction (Cont.) Visibility Challenges Cause Waste Do Work UnnecessaryRework LateDeliveries Deliverables Inputs Poor InfoHandoffs NumerousStatus Meetings OverloadedResources TribalKnowledge How do you know…?
Introduction (Cont.) Man- -age Status 1 … Status Status n The Plan The Work What limits visibility? Management / Work Gap Limits Visibility
Introduction (Cont.) Ideal – Real-time GPS Old Way – Paper Map • Advantages: • Real-time / dynamic • Turn by turn directions • Traffic alerts • Limitations: • Static • Best route unclear • Can’t see traffic Ideal – Interactive Process Old Way – Gantt/Procedure/Spreadsheet • Advantages: • Real-time / dynamic • Task by task directions • Instant status visibility • Limitations: • Static • No Information flow • Status outdated How can we see where to go?
Process Management with VdotTM Kit for Tools Work Instructions Kit for Materials How does Vdot Work?Lean Factory “Kit” Analogy
Process Management with VdotTM (con’t) Full Task Definition: What to do, When to do it, Tool, Owner, Instructions, Duration, Effort , Critical Path, … Required Inputs Establish Requirements Ready: 03-04-2014 Start By: 03-03-2014 MS Excel Establish Requirements Started: 03-04-2014 Done: 03-09-2014 MS Excel Establish Requirements Started: 03-04-2014 Est. End: 03-09-2014 MS Excel Requirements Customer Inputs Systems Analysis Environment Mission Scenarios Systems Engineer Status: Red - Ready Yellow - In Work Green - Done Deliverables 5.00d : 30.00h : 20.00% 5.00d : 30.00h : 100.00% 5.00d : 30.00h : 0.00% Vdot™ “Smart Task Kits” Completely Define Activities Everything Required for the Task at Hand at the Right Time
Process Management with VdotTM (Cont.) Smart Task Flows Vdot Process Platform Visual Process Control Connected to the Work Nest Your Processes Real-Time Dashboards Embed Your Applications Improved Project Planning, Execution, and Efficiency
Process Management with VdotTM (Cont.) • Real-Time Dashboards for Managers • Summarize team performance • Drill down to individual performance • Reflect work as it is performed • Project Snapshots • Gantt Charts • Workloads • Requirements • Task Lists for Team • Gives task priority / schedule information • Can launch tasks straight from list • Reflects as-planned and as-changed work … Real-Time Information via the Web for All Participants
Process Management with VdotTM (Cont.) • 3 days: initial process capture • 2 weeks: process improvements • 3 months: project payback Easy, Rapid Implementation. Dramatic Savings.
NASA ETO Architecture Analysis The ETO group is looking at various Space Launch System (SLS) heavy lift vehicle architectures, and is tasked to answer the questions: Will it work? What will it look like? What is the preliminary design?
Managing the ETO Architecture Analysis The ETO SLS Evolvability Study Execution template was put into production in Nov 2013. This process template is repeatable and reusable for all ETO SLS study cases. Once activated, multiple Vdot study cases can run simultaneously. Example of one sequence where iterations are required is shown here.
Managing the ETO Architecture Analysis (Cont.) Run times have improved from weeks to hours with Vdot. And the state of the data being analyzed is captured for each step in a database. The results of each ACO analysis are summarized in a “baseball card” showing the architecture of the mission. Productivity for these analyses has soared with the use of Vdot. • As of 3/31/14 • 485 Study Cases Completed • 132 Baseball Cards Generated • 19,000+ tasks executed in the system
Sandia Closed Brayton Cycle (CBC) Development Sandia took the lead in investigating the supercritical carbon dioxide (S-CO2) Brayton cycle using internal research and development funds in 2007. Initial investigations focused on the stability of S-CO2 as a working fluid very near the fluid’s critical point – a thermodynamic state in which fluid properties vary dramatically. STEP is funded @$27.5M for FY15, S-CO2 @$57M.
Managing the CBC Technology R&D The use of supercritical carbon dioxide can produce energy conversion efficiencies significantly higher than that for steam, the current standard working medium. Hence the push for commercialization efforts in parallel to the R&D.
Managing the STEP Initiative As the technology R&D moves toward the full validation of these features, the DOE has a very specific set of instructions that will guide the STEP program. Available online at www.directives.doe.gov, the document “Managing Design and Construction Using Systems Engineering” will be our guide.
Managing the STEP Initiative (Cont.) • The following representative table contains an example of the process steps required for a sample Critical Decision (CD). The process steps for each CD have been modeled in Vdot, and the overall top-level view of all the nested CDs is shown here. Nested process expanded for “Prior to CD-1” on next slide
Managing the STEP Initiative (Cont.) • The process steps for “Prior to CD-1” have been modeled in Vdot, as shown. This is an expansion from the nested process.
Conclusion Vdot™ Bridges Plan/Work Gap Man- -age Status 1 … Status Status n The Plan The Work Real-Time Visibility for the Entire Team in a Shared Environment
Conclusion (Cont.) • NASA’s ETO Architecture Analysis benefits from Vdot by sequencing necessary tasks, deliverables, and team interactions required to produce quality products on time and within budget. • The Sandia CBC demonstration project will see a set of macros that will work with a variety of commercially available tools to help automate, execute, and track the systems engineering process. • Vdot™ provides an off-the-shelf platform to support automation of these and more scenarios allowing real-time, traceable collaboration between process participants.
The author would like to acknowledge Damian Yañez (with ESI Group North America) for his mapping of the DOE Acquisition Management process in Vdot, Linda Hudgins (Qualis Corporation) for her mapping of the ETO processes in the Vdot software platform, and Sue Delary (Qualis Corporation) for her thorough job of editing. Also, the author acknowledges the support and collaboration from Sandia’s Dr. Jim Pasch, S-CO2 Principal Investigator, and Gary Rochau, Manager, Advanced Nuclear Concepts, and acknowledge the support from Jay Newkirk, Executive Director of Energy Huntsville. Acknowledgements