Download
1 / 17
170 likes | 261 Views
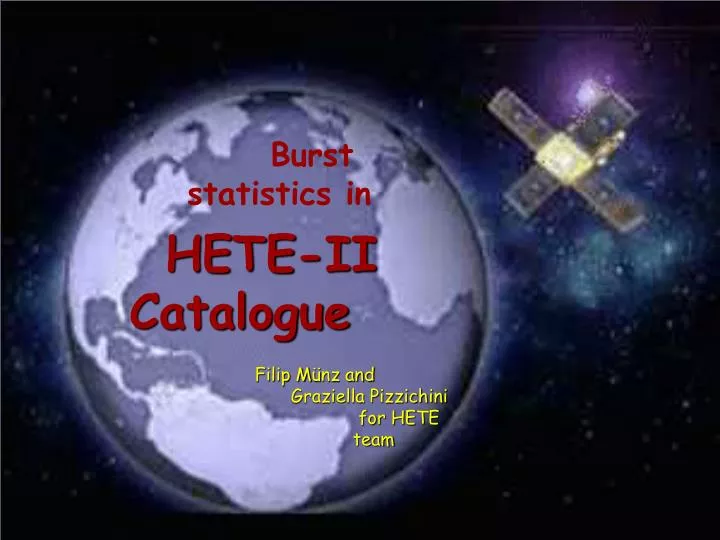
Burst statistics in. HETE-II Catalogue. Filip M ü nz and Graziella Pizzichini for HETE team. High Energy Transient Experiment – II. gamma-ray detector French Gamma-ray Telescope (FREGATE): 5-400 keV; ~ π FOV no localization

E N D
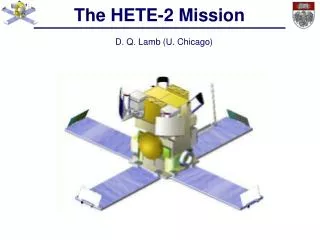
Burst statistics in HETE-II Catalogue Filip Münz and Graziella Pizzichini for HETE team
High Energy Transient Experiment – II • gamma-ray detectorFrench Gamma-ray Telescope (FREGATE): 5-400 keV; ~π FOVno localization • position sensitive instrumentsWide-Field X-ray Monitor (WXM): 2-25 keV; ~5’-10’ localizationsSoft X-ray Cameras (SXC): 2-10 keV; ~40” localizationssmall eff. surface / sensitivity • direct alert transmission through simple VHF stations along the equatorial trajectory (incl. Italian base at Malindi) very small scale mission mass: 123 kg size: 89 x 66 cm (launch size) SAIt meeting, Teramo 2008
Alert distribution IASF-BO people E. Morelli F. Gianotti P. Ferrero F. Munz G. Pizzichini equatorial orbit @ 625 km SAIt meeting, Teramo 2008
Detector response • FREGATE • large FoV implies high background (with Earth occultation of sources due to fixed pointing ) • WXM • extension to lower energies with complicated response matrix (1-D coded masks) SAIt meeting, Teramo 2008
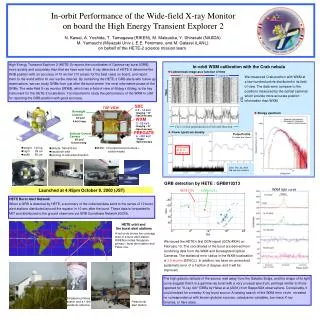
HETE bursts and flashes • 1292 GCN alerts • 173 bursts • 143 localized • (110 within 1 hour) SAIt meeting, Teramo 2008
HETE catalog completing, verifying, mining … SAIt meeting, Teramo 2008
Band (X/gamma) Peak (times,fluence) GCN notices Afterglow measures Position info Catalogue structure Spectral fits • Database (mySQL) with object interface (and web replication ) • Numerical Python, Django, JQuery • light-curve profiles in ASCII/FITS • procedures to load and subtract background Burst (trigger info) Alert (time of distribution) Literature refer. SAIt meeting, Teramo 2008
All links on one page to general catalogue to GCN notices to literature custom notices GRB entry SAIt meeting, Teramo 2008
Checking the catalogue • correlation of different variables (160 entries) • looking for outliers SAIt meeting, Teramo 2008
Afterglows • Many bursts have good coverage of optical afterglows • Combining with analysis of prompt lightcurves SAIt meeting, Teramo 2008
Success of followups • highlights • GRB 030329B (690/488) • GRB 021004 (178/123) • GRB 020813 (77/67) (until 2007) • result of ground-obs. friendly (anti-solar) HETE pointing • too many bursts in SWIFT era SAIt meeting, Teramo 2008
FREGATE analysis in 4 spectral bands time sampling at cca 0.1 s conversion to physical units using off-axis angle and spectral shape spectrum fitted in 69 cases Prompt emission SAIt meeting, Teramo 2008
Lightcurve analysis • trying to extract more detailed information besides T90/fluence • developing methods for identification of peaks • rise/fall time • variation of hardness ratio SAIt meeting, Teramo 2008
Lightcurve parade SAIt meeting, Teramo 2008
Lightcurve analysis • Sometimes the main structurecomes with considerable delay(no backgroundinformation after the burst) SAIt meeting, Teramo 2008
Lightcurve analysis • in some cases the baseline level isnot evident at all! • aim is to verify the catalogued values and deepen the understanding of X-ray rich events SAIt meeting, Teramo 2008
Work in progress • make catalogue ready for public • checking outliers • linking the literature • polishing the interface • prompt emission studies • more detailed statistics • comparison with other datasets (BATSE, Swift) • need for robust peak-analysis technique • better pseudo-redshift indicator SAIt meeting, Teramo 2008