Download
1 / 48
480 likes | 586 Views
“Life Cycle Assessments of Wind Energy and Other Renewables”…. Gregory A. Norris KSU 5 January 2006. Motivating Questions. Which is better (from an environmental point of view): Wind or Photovoltaics? Why? How so? Big (utility-scale) wind vs. small (local) wind

E N D
“Life Cycle Assessments ofWind Energy and Other Renewables”… Gregory A. Norris KSU 5 January 2006
Motivating Questions • Which is better (from an environmental point of view): Wind or Photovoltaics? • Why? How so? • Big (utility-scale) wind vs. small (local) wind • What are priorities for improving either? • How much better is wind than coal?
Environment Economic Social
Environment Pollutants & wastes Human Health Resource use /Resource depletion Pollutants & wastes Ecosystem Health
Environment • Resource use /Resource depletion • Mineral resources • Fossil fuels • Pollutants & wastes Human Health • Respiratory Organics • Carcinogens • Particulates • Climate Change • Radiation • Ozone Layer depletion • Pollutants & wastes Ecosystem Health • Eco-toxicity • Acidification • Eutrophication • Land use
Outline • Method 1: Life Cycle Assessment • Method 2: Risk / Damage Assessment • LCA+RA Example: Weatherization • LCA Examples: • Wind Energy • Photovoltaic Electricity • Coal vs. wind
Method 1: Life Cycle Assessment • Product life cycles, and their totalsystem-wide impacts • Environment • (Economic and Social) • “Cradle to Grave” • Quantitative • Data-intensive • Standardized (ISO) • Becoming Global
LCA DefinedISO 14040 (‘97) Life Cycle Assessment Framework Goal & Scope Definition Interpretation Direct Applications: * Product Development & Improvement * Strategic planning * Public policy making * Marketing * Other Inventory Analysis Impact Assessment
Life Cycle Inventory Analysis Releases to environment Extractions from environment
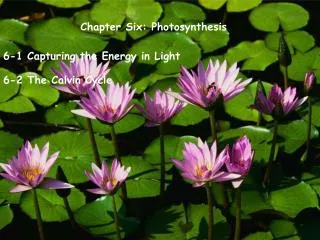
Life Cycle Impact Assessment • “What do all these flows mean?” • Prototype: Global Warming Potentials • Other Common Impact Categories • Ozone Depletion • Acidification • Eutrophication • Smog Formation • Human Toxicity / Health • Eco Toxicity
Risk Analysis • Risk Assessment • Risk Characterization • Risk Communication • Risk Management • Policy Relating to Risk
Exposure & Health Assessment: Emissions Atmospheric fate & transport Concentrations Census Data, GIS Exposures Dose-responsevia Epi-studies Health Effects
Aggregating Health Impacts • DALY = Disability-Adjusted Life-Year • Mortality life-years lost • Morbidity years lived at lower quality • Way to combine mortality & morbidity impacts into a single measure of effective life-years lost • World Health Organization
Wx Example: Methods Summary Energy Modeling Climate DamageAssessment Life Cycle Assessment Exposure &HealthAssessment Air Health/Wealth relationship(Keeney 1997) Health $
Wx Scenarios • New and existing homes meet IECC2000 by increasing insulation • Loan program for financing the upfront cost of insulation • 2.5% interest rate • 20 years maximum loan term • Loan payments=energy savings until paid in full • 2% annual participation rate for existing homes • 58% of new SFH; 81% of existing homes will participate
End-use energy savingsand health outcomes by State Premature deaths avoided Energy savings Source: Nishioka et al. 2002. 10-year horizon: All new SF homes from 1999 standard practice to IECC 2000.
Results for PM Pathway • Health benefits of 1 year of energy savings for 1 year’s housing cohort: • 7 fewer fatalities • 200 fewer asthma attacks • 3000 fewer restricted activity days • Health benefits of 50-year measure life, for 1 year’s housing cohort: • 350 fewer fatalities • 10K fewer asthma attacks • 150K fewer restricted activity days 70 DALYs 3500 DALYs
Results for GHG Pathway • Tol (1999): FUND model • Climate-related pathways considered: • Heat and cold-related illnesses & deaths • Vector-borne diseases (e.g., malaria) • Infectious diseases due to sea-level rise via population displacement, infrastructure • Psychological disorders via sea-level rise
Results for GHG Pathway • Health benefits of 1 year of energy savings for 1 year’s housing cohort: • 20 fewer fatalities • 400 fewer DALYs • Health benefits of 50-year measure life, for 1 year’s housing cohort: • 1000 fewer fatalities • 20K fewer DALYs
Results via Financial Savings Source: Keeney 1997
Results via Financial Savings • Conservative assumption: • Net zero annual economic impact until cost of insulation measures paid forby energy savings, with 2.5% interest rate • Health benefits of 50-year measure life, for 1 year’s housing cohort: • 600 fewer fatalities • 7K fewer DALYs
Outline • Method 1: Life Cycle Assessment • Method 2: Risk / Damage Assessment • LCA+RA Example: Weatherization • LCA Examples: • Wind Energy • Photovoltaic Electricity • Coal vs. wind
Scope: 800 kW Utility Wind • Construction and operation of wind power with necessary change of gear oil • Capacity factor: 20% • Gear oil changed every second year • Fixed parts lifetime: 40 years • Moving parts lifetime: 20 years • Efficiency: 25% • Wind conditions: Average European
Scope: 800 kW Turbine Model • Rotor, nacelle, electric parts, and their disposal • Energy for assembling/fabrication and transport • Connection to the grid • … Total of 1561 unit processes in system, plus loops
800 kW Utility Wind Turbine Production Supply Chain: Process contributions to total Human Health Impacts
800 kW Utility Wind Turbine Production Supply Chain: Process contributions to total Ecosystem Impacts
Utility-scale wind (2 MW, offshore)
Environment Pollutants & wastes Human Health Resource use /Resource depletion Pollutants & wastes Ecosystem Health