Download
1 / 28
280 likes | 430 Views
Project Management. Projects involve balancing the following: • Time • Cost • Quality • Scope Project management is about making that happen. Problems with software project management. Software is intangible What is 90% complete? The process is still not standardised

E N D
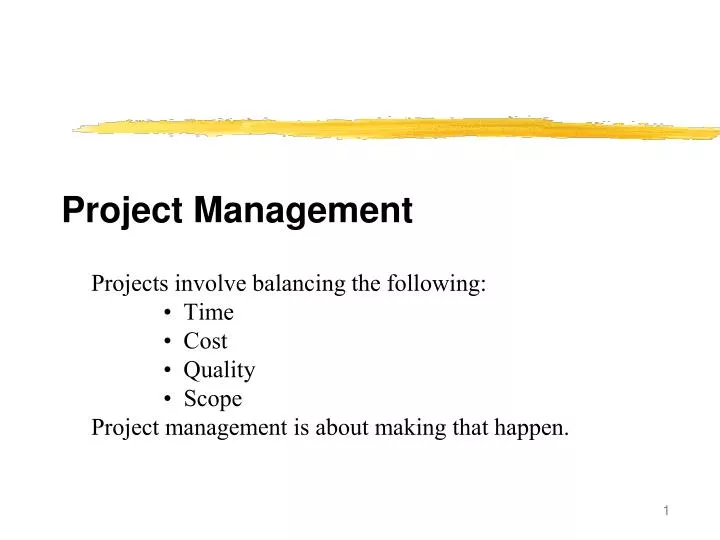
Project Management Projects involve balancing the following: • Time • Cost • Quality • Scope Project management is about making that happen.
Problems with software project management • Software is intangible • What is 90% complete? • The process is still not standardised • Software is complex and varied • Many projects cannot easily be compared to any previous one • How many people build air traffic control systems? • Whose process control is the same as another? • Different companies are tied to different hardware and different tools
Aspects of project management • Plan the project • Create Project Plan, and other management documents such as • Quality plan - quality procedures and standards • Validation plan - approach, resources and schedule • Configuration Management plan - CM procedures and structures • Maintenance plan - requirements/costs and effort • Staff Development plan - developing team member skills and experience • Monitor project • Control/Problem solving
Likely Structure for Project Plan • Introduction / overview • Organisation of the project • Risk analysis • Hardware and software resource requirements • Work breakdown • Project schedule • Monitoring and reporting mechanisms
Steps to fill in the Project Plan Work breakdown and scheduling are the hard parts and need the following steps: 1. Decide on activities 2. Identify dependencies between activities 3. Schedule the activities over time 4. Decide on milestones and deliverables 5. Allocate resources to the activities
Planning (1) : Activities • You need to identify activities involved in the project • Major activities, such as requirements analysis, design analysis. • Minor activities, such as the activities used to produce a document: • Prepare • Internal review • Walkthrough • Modify • QA check after modification • Formal Review • Modifications • Approval by customer • Label all major activities with name and reference ID
Planning (2) : Identify Dependencies ASK: What activities cannot be started until others are completed? OR What activities cannot be completed until others are completed? Task ID Depends on T1 T2 T3 T1 T4 T2, T3 T5 T4
Planning (3) : Project Scheduling • Scheduling is very difficult • Need to estimate time, resources • Need to organise them into a sensible sequence. • This can be difficult if no experience of a similar project • Issues of different hardware/languages etc. • Estimates need to be revised in light of experience • Project plan is a dynamic document • Need to allow for other issues: • Illness, staff leaving, hardware faults, late delivery of tools/data, holidays
Planning (3) : Project Scheduling (continued) • Estimating resources required • Human effort • Disk space • Travel / subsistence • Special equipment • Usual output is an bar chart - sometimes called a Gantt chart
Planning (4) - Milestones, Deliverables • We must have some way to measure progress • It can be done by identifying important milestones Milestone : end point of some activity • You will be able to see if you have completed the activity • There should be a report to management (possibly short) • Each milestone needs to be at some logical point - e.g. not partway through coding. • Not all activities need to end in a milestone • Avoid milestones being too frequent • Avoid milestones being too infrequent Deliverable : a result delivered to the customer (documents, beta versions, final version, … )
Planning (5) : Resource Allocation • Try to allocate sensibly • Bar chart with the people named • Looking for gross allocation clashes (people can only spend 100% of their time; a machine can’t be in Coventry and Detroit) • There are two important types of dependencies in a plan: • Logical/task dependencies • Staff dependencies • Update resource allocations in light of experience • May change schedule to overcome problems • Can get an allocation profile/staff allocation chart - this can be produced automatically
Task List/Time Estimates Task Est. Time Dependencies T1 8 T2 15 T3 5 T1 T4 10 T2, T3 T5 12 T4
Task Est. Time Dependencies T1 8 T2 15 T3 5 T1 T4 10 T2, T3 T5 12 T4 Tools for PMActivity Chart or Task Chart 8 days 5 days 10 days 12 days T3 T1 Finish T4 T5 Start T2 Often drawn with tasks and durations ON lines rather than at end of lines 15 days critical path
Comments on Activity Charts • Critical path (CP) is the minimum time to finish the project - the longest path in the activity chart • Slippage will cause project delays if task on CP • Slippage of tasks not on CP may not cause delays. • A more sophisticated version of the activity chart is known as the PERT chart • Same type of info, but milestones are boxes and activity/duration are on the links • Makes pessimistic/likely/optimistic estimates • Leads to many critical paths - need specialised tools for chart analysis • These charts can provide insight to dependencies that are not intuitively obvious
Activity charts and Bar charts • Activity charts show interrelationships between tasks • Bar charts show activity duration and tasks that run concurrently. Also associated with dates • Shaded area shows length of time a task/activity can slip before affecting project completion time • The two types of chart are complementary in nature - can generate bar chart from activity chart • Best to use a project scheduling tool to create activity and bar charts • These schedules need to be updated in the light of experience during the project
Staff allocation charts Used in addition to Activity and Bar charts • Based on bar charts • Look for overloads • Look for unreasonable gaps • Look for unreasonable overall workload/too light a workload for particular people
Warnings to consider when planning • A plan is only useful if it reflects reality and is achievable • Need to manage staff morale • Need to manage user expectations • Consider all activities during the project, but simplify for bar chart • Project Managers can be mesmerised by the plan produced with a tool: • Changing the plan only works if you do something to influence reality • Change can have a negative effect
Project monitoring • Project manager should monitor against plan constantly • Difficult to gauge progress on large tasks (so breaking them down helps) • Key monitoring opportunity is weekly meeting and at milestones • Given information, the manager needs to assess if there is potential for slippage • Decisions/actions need to be recorded • Major changes should be reflected in the project plan
Project Control/Problem Solving • Try to catch up slippage • May mean swapping staff around • Beware of adding new staff • Look for specific skills • Re-negotiate to change the scope of the task/project • May be contractually bound • Revise plan • Possibly change tasks to remove them from critical path • Can tasks be decomposed to allow progress? Be careful! • Improve resources if necessary / helpful • Deal with staff that are not performing
Example plan - Dougal Project • Over half a million pounds of effort • 10 man years over 3 elapsed years • Especially complex in first year where 6 man years are spent • Task One (four man years during first year) planned as a separate project for political reasons
Example milestones for Dougal Milestone 1: A documented list of relevant schematics, and identified testing criteria. There will be a document containing a list of circuit designs. For each circuit, the reasons why they present a problem for the state of the art will be provided, along with the expected results. The circuits will be provided as CAD files.Date of delivery: End of month 3 of project. Milestone 2: A detailed design for a numerical based design analysis system. This design document will provide a description for the software to be developed during the rest of workpackage 1. Date of delivery: End of month 3 of project. Milestone 3: Report on the evaluation of the numerical simulator based design analysis system. At the end of this task, software will be available which can use a numerical simulator as a basis, and produce analysis results of the calibre of those produced by AutoSteve for qualitative simulation. A report will be produced describing how well the new software handles the case studies that were identified as problems for AutoSteve. During months 11, 12, the software will also be evaluated by the industrial partners, and results of that evaluation will also be included in the report. Date of delivery: End of month 12 of project. Milestone 7: Whole vehicle FMEA. This task should deliver FMEA generation software capable of working on the complete circuitry of a car and producing useful FMEA results. This should be tied to whole system level results (rather than be a compilation of all lower level results – an example would be investigation of ground stud losses).Date of delivery: End of month 14 of project.
Monitoring for Dougal • Weekly meeting of all internal staff • Review of progress • Identification of potential problems / actions • Targets for the coming week • Monthly report to customers • Summary of progress • Issues for discussion with customer • Telephone conversation between related parties • Three monthly project meeting • Longer report • New version of project plan (if necessary)
Software Cost Estimation • How do I tell how much effort is required to build a specific piece of software? • experience • experiment • techniques such as function point analysis • How much calendar time is required? • What is total cost of project? Inc. non-staff costs: • Hardware + software • Travel and training • Effort costs (staffing)
Calculating Costs for Staff • Total cost of a member of staff includes: • Heating and lighting • Support staff • Networking and communications • Central facilities (library etc.) • Costs of illness, holidays, idle time, pensions, health plans, etc. • Most companies do not charge customers directly for all of these things - they factor in an overhead cost • Prices may also be affected by other organisational factors…
Pricing Factors • Market Opportunity • You might pitch your price low to enter the market • Cost Estimate Uncertainty • Uncertain of cost, so increase price above normal profit • Contractual Terms • Give the developers rights to code, possibility of selling/reuse • Requirements volatility • If reqs. are likely to change, price low and charge for changes. • Financial Health • Lower price if in financial difficulty, better to stay in business. • “Get lost” price • Too much work on. Price high to make it worth your while
What we said at start: • Project management is a compromise, about achieving a satisfactory result in terms of: • Time • Cost • Quality • Scope • “Satisfactory” should mean satisfactory to our company AND satisfactory to our clients