Download
1 / 8
80 likes | 207 Views
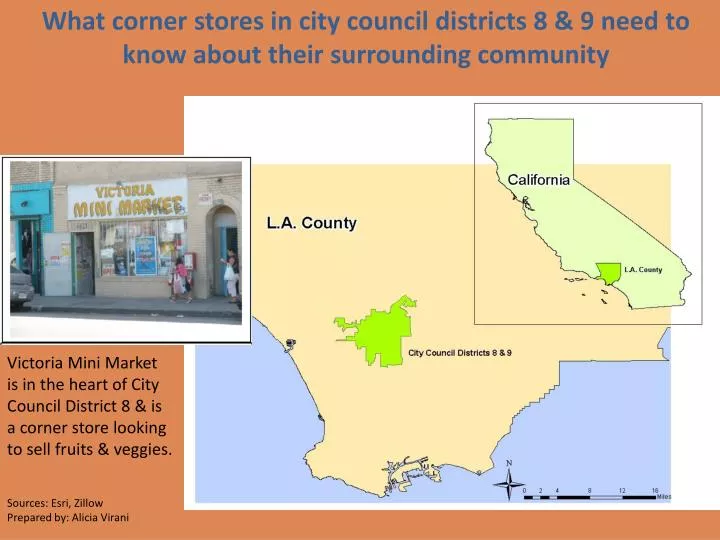
What corner stores in city council districts 8 & 9 need to know about their surrounding community. Victoria Mini Market is in the heart of City Council District 8 & is a corner store looking to sell fruits & veggies. Sources: Esri, Zillow Prepared by: Alicia Virani. Title. Bernard Parks

E N D
What corner stores in city council districts 8 & 9 need to know about their surrounding community Victoria Mini Market is in the heart of City Council District 8 & is a corner store looking to sell fruits & veggies. Sources: Esri, ZillowPrepared by: Alicia Virani
Title Bernard Parks Councilperson for District 8 Jan Perry Councilperson for District 9 Sources: Esri Prepared by: Alicia Virani
Median Income by Block Group in City Council Districts 8 & 9 The total population for these two districts is 588,361. Median Income is: $24, 676 Sources: Esri, US Census Prepared by: Alicia Virani
Large Chain Grocery Stores in City Council Districts 8 & 9 There is one grocery store for every 60,000 residents in this area. If only the 4 largest grocery stores are counted, there is only one grocery store for every 150,000 residents. Sources: Esri, CA Dept. of Public Health Prepared by: Alicia Virani
Corner Stores v. Fruit & Veggie Vendors Location of convenience stores Location of fruit and vegetable markets “Convenience other” is a convenience store that is independent or in a chain of 4 or fewer stores. These are your typical “corner stores”. There are a total of 64 corner stores, which amounts to 1 corner store for every 9,000 residents The sales volume for the fruit & vegetable vendors can serve as an example for corner stores that wish to sell fruits & vegetables. Sources: Esri, CA Dept. of Public Health Prepared by: Alicia Virani
Grocery stores in these districts are walking distance* from only 9% of the population The 4 largest grocery stores in these districts have a total of 51,534 people within a .5 mile radius. This leaves 91%of the population at a distance of .5 miles or greater from a large grocery store. Corner stores are far more accessible due to their sheer numbers. *Walking Distance = within .5 miles Large chain stores and population density Sources: Esri, CA Dept. of Public Health Prepared by: Alicia Virani
Corner stores should accept food stamps if they want to attract and cater to their surrounding communities Percentage of people receiving food stamps by block group • The median percentage of people receiving food stamps is 16%. • Because of the accessibility of corner stores in these districts, they would benefit from selling fruits and vegetables and accepting food stamps to encourage greater patronage. Sources: Esri, CA Dept. of Public Health Prepared by: Alicia Virani
Skills used • Inset Map (Slide 1) • Point graduated symbol (Slides 4 & 5) • Boundary subsets selection (All slides: city council districts 8 & 9 were selected from all LA County city council districts and converted to a shape file) • Buffering (Slide 6) • Geoprocessing (All slides: the two city council districts were dissolved into one; clipping was used for all slides to clip L.A.-wide data (grocery stores, convenience stores, fruit & veggie vendors, food stamp %, population income, etc.) to the city council districts. • Geocoding (Slides 4, 5, 6, & 7)