Download
1 / 1
10 likes | 195 Views

E N D
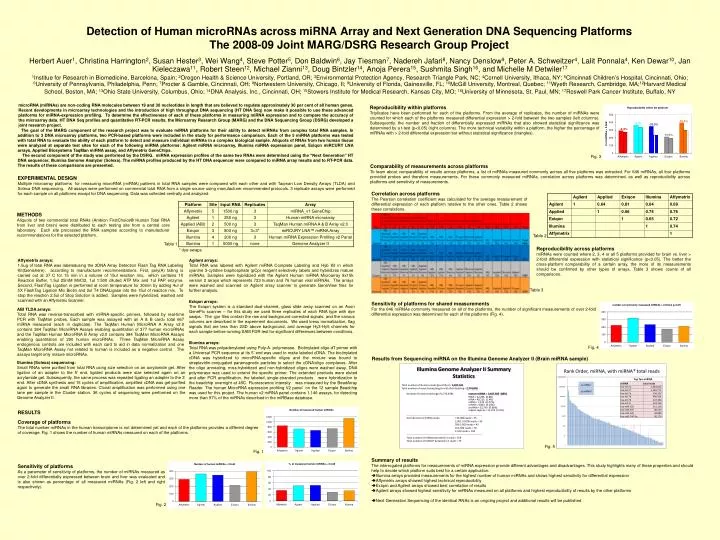
microRNA (miRNAs) are non-coding RNA molecules between 19 and 30 nucleotides in length that are believed to regulate approximately 30 per cent of all human genes. Recent developments in microarray technologies and the introduction of high throughput DNA sequencing (HT DNA Seq) now make it possible to use these advanced platforms for miRNA-expression profiling. To determine the effectiveness of each of these platforms in measuring miRNA expression and to compare the accuracy of the microarray data. HT DNA Seq profiles and quantitative RT-PCR results, the Microarray Research Group (MARG) and the DNA Sequencing Group (DSRG) developed a joint research project. Reproducibility within platforms Triplicates have been performed for each of the platforms. From the average of replicates, the number of miRNAs were counted for which each of the platforms measured differential expression > 2-fold between the two samples (left columns). Subsequently, the number and fraction of differentially expressed miRNAs that also showed statistical significance was determined by a t-test (p<0.05) (right columns). The more technical variability within a platform, the higher the percentage of miRNAs with > 2-fold differential expression but without statistical significance (triangles). -25.9% -8.3% -33.0% -6.8% The goal of the MARG component of the research project was to evaluate miRNA platforms for their ability to detect miRNAs from complex total RNA samples. In addition to 3 DNA microarray platforms, two PCR-based platforms were included in the study for performance comparison. Each of the 5 miRNA platforms was tested with total RNA to evaluate the ability of each platform to detect and measure individual miRNAs in a complex biological sample. Aliquots of RNAs from two human tissue were analyzed at separate test sites for each of the following miRNA platforms: Agilent miRNA microarray, Illumina miRNA expression panel, Exiqon miRCURY LNA arrays, Applied Biosystems TaqMan miRNA assay, and Affymetrix GeneChips. The second component of the study was performed by the DSRG. miRNA expression profiles of the same two RNAs were determined using the “Next Generation” HT DNA sequencer, Illumina Genome Analyzer (Solexa). The miRNA profiles produced by the HT DNA sequencer were compared to miRNA array results and to RT-PCR data. The results of these comparisons are presented. -10.0% Fig. 3 Comparability of measurements across platforms To learn about comparability of results across platforms, a list of miRNAs measured commonly across all five platforms was extracted. For 646 miRNAs, all four platforms provided probes and therefore measurements. For these commonly measured miRNAs, correlation across platforms was determined, as well as reproducibility across platforms and sensitivity of measurements. Detection of Human microRNAs across miRNA Array and Next Generation DNA Sequencing PlatformsThe 2008-09 Joint MARG/DSRG Research Group Project EXPERIMENTAL DESIGN Multiple microarray platforms for measuring microRNA (miRNA) patterns in total RNA samples were compared with each other and with Taqman Low Density Arrays (TLDA) and Solexa DNA sequencing. All assays were performed on commercial total RNA from a single source using manufacturer recommended protocols. 3 replicate assays were performed for each sample on all platforms except for DNA sequencing. Data was collected centrally and analyzed. Correlation across platforms The Pearson correlation coefficient was calculated for the average measurement of differential expression of each platform relative to the other ones. Table 2 shows these correlations. METHODS Aliquots of two commercial total RNAs (Ambion FirstChoice® Human Total RNA from liver and brain) were distributed to each testing site from a central core laboratory. Each site processed the RNA samples according to manufacturer recommendations for the selected platform. Table 2 Table 1 Reproducibility across platforms miRNAs were counted where 2, 3, 4 or all 5 platforms provided for brain vs. liver > 2-fold differential expression with statistical significance (p<0.05). The better the cross-platform comparability of a certain array, the more of its measurements should be confirmed by other types of arrays. Table 3 shows counts of all comparisons. * dye-swaps Agilent arrays: Total RNA was labeled with Agilent miRNA Complete Labeling and Hyb Kit in which cyanine 3-cytidine bisphosphate (pCp) reagent selectively labels and hybridizes mature miRNAs. Samples were hybridized with the Agilent Human miRNA Microarray 8x15k version 2 arrays which represents 723 human and 76 human viral miRNAs. The arrays were washed and scanned on Agilent array scanner to generate GeneView files for further analysis. Affymetrix arrays: 1.5ug of total RNA was labeledusing the 3DNA Array Detection Flash Tag RNA Labeling Kit(Genishere), according to manufacturer recommendations. First, poly(A) tailing is carried out at 37 C for 15 min in a volume of 15ul reaction mix, which contains 1X Reaction Buffer, 1.5ul 25mM MnCl2, 1ul 1:500 diluted ATP Mix and 1ul PAP enzyme. Second, FlashTag Ligation is performed at room temperature for 30min by adding 4ul of 5X FlashTag Ligation Mix Biotin and 2ul T4 DNALigase into the 15ul of reaction mix. To stop the reaction 2.5ul of Stop Solution is added. Samples were hybridized, washed and scanned with an Affymetrix Scanner. Table 3 Exiqon arrays: The Exiqon system is a standard dual-channel, glass slide array scanned on an Axon GenePix scanner – for this study we used three replicates of each RNA type with dye swaps. The .gpr files contain the raw and background corrected signals, and the various columns are described in the experiment documents. We used loess normalization, flag signals that are less than 2SD above background, and average Hy3-Hy5 channels for each sample before running SAM FDR test for significant differences between conditions. Sensitivity of platforms for shared measurements For the 646 miRNAs commonly measured on all of the platforms, the number of significant measurements of over 2-fold differential expression was determined for each of the platforms (Fig. 4). Herbert Auer1, Christina Harrington2, Susan Hester3, Wei Wang4, Steve Potter5, Don Baldwin6, Jay Tiesman7, Nadereh Jafari8, Nancy Denslow9, Peter A. Schweitzer4, Lalit Ponnala4, Ken Dewar10, Jan Kieleczawa11, Robert Steen12, Michael Zianni13, Doug Bintzler14, Anoja Perera15, Sushmita Singh16, and Michelle M Detwiler17 1Institue for Research in Biomedicine, Barcelona, Spain; 2Oregon Health & Science University, Portland, OR; 3Environmental Protection Agency, Research Triangle Park, NC; 4Cornell University, Ithaca, NY; 5Cincinnati Children’s Hospital, Cincinnati, Ohio; 6University of Pennsylvania, Philadelphia, Penn; 7Procter & Gamble, Cincinnati, OH; 8Nortwestern University, Chicago, Il; 9University of Florida, Gainesville, FL; 10McGill University, Montreal, Quebec; 11Wyeth Research, Cambridge, MA;12Harvard Medical School, Boston, MA; 13Ohio State University, Columbus, Ohio; 14DNA Analysis, Inc., Cincinnati, OH; 15Stowers Institute for Medical Research, Kansas City, MO; 16University of Minnesota, St. Paul, MN; 17Roswell Park Cancer Institute, Buffalo, NY ABI TLDA arrays: Total RNA was reverse-transcribed with miRNA-specific primers, followed by real-time PCR with TaqMan probes. Each sample was assayed with an A & B card= total 667 miRNA measured (each in duplicate). The TaqMan Human MicroRNA A Array v2.0 contains 384 TaqMan MicroRNA Assays enabling quantitation of 377 human microRNAs and the TaqMan Human MicroRNA B Array v2.0 contains 384 TaqMan MicroRNA Assays enabling quantitation of 290 human microRNAs. Three TaqMan MicroRNA Assay endogenous controls are included with each card to aid in data normalization and one TaqMan MicroRNA Assay not related to human is included as a negative control. The assays target only mature microRNAs. Illumina arrays: Total RNA was polyadenylated using Poly-A- polymerase. Biotinylated oligo-dT primer with a Universal PCR sequence at its 5’ end was used to make labeled cDNA. The biotinylated cDNA was hybridized to microRNA-specific oligos and the mixture was bound to streptavidin-conjugated paramagnetic particles to select the cDNA/oligo complexes. After the oligo annealing, miss-hybridized and non-hybridized oligos were washed away. DNA polymerase was used to extend the specific primer. The extended products were eluted and after PCR amplification, the labeled, single-stranded products were hybridization to the beadchip overnight at 45C. Fluorescence intensity was measured by the BeadArray Reader. The human MicroRNA expression profiling V2 panel on the 12 sample Beadchip was used for this project. The human v2 miRNA panel contains 1,146 assays, for detecting more than 97% of the miRNAs described in the miRBase database. Fig. 4 Results from Sequencing miRNA on the Illumina Genome Analyzer II (Brain miRNA sample) Illumina (Solexa) sequencing: Small RNAs were purified from total RNA using size selection on an acrylamide gel. After ligation of an adapter to the 5’ end, ligated products were size selected again on an acrylamide gel. Subsequently, the same process was repeated ligating an adapter to the 3’ end. After cDNA synthesis and 15 cycles of amplification, amplified cDNA was gel-purified again to generate the small RNA libraries. Clonal amplification was performed using one lane per sample in the Cluster station. 36 cycles of sequencing were performed on the Genome Analyzer II. RESULTS Coverage of platforms The total number miRNAs in the human transcriptome is not determined yet and each of the platforms provides a different degree of coverage. Fig. 1 shows the number of human miRNAs measured on each of the platforms. Fig. 5 Fig. 1 • Summary of results • The interrogated platforms for measurements of miRNA expression provide different advantages and disadvantages. This study highlights many of these properties and should help to decide which platform suits best for a certain application: • Illumina arrays provided measurements for the highest number of human miRNAs and shows highest sensitivity for differential expression • Affymetrix arrays showed highest technical reproducibility • Exiqon and Agilent arrays showed best correlation of results • Agilent arrays showed highest sensitivity for miRNAs measured on all platforms and highest reproducibility of results by the other platforms • Next Generation Sequencing of the identical RNAs is an ongoing project and additional results will be published Sensitivity of platforms As a parameter of sensitivity of platforms, the number of miRNAs measured as over 2-fold differentially expressed between brain and liver was evaluated and is also shown as percentage of all measured miRNAs (Fig. 2 left and right respectively). Fig. 2