Download
1 / 23
230 likes | 379 Views
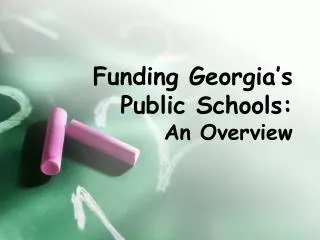
Funding for Illinois Public Schools. Dr. William H. Phillips A special thank you goes to Toni Waggoner, Budget and Financial Management, Illinois State Board of Education, for assisting with this project. State, Local and Federal Funding.

E N D
Funding for Illinois Public Schools Dr. William H. Phillips A special thank you goes to Toni Waggoner, Budget and Financial Management, Illinois State Board of Education, for assisting with this project.
State, Local and Federal ResourcesFor Elementary & Secondary($ in Millions)
FY 2010 Federal ProgramsBy Appropriation • Economically Disadvantaged (Title I) $1,281 M • Special Education (IDEA) $1,123 M • Child Nutrition $ 529 M • Teacher/Principal Training (Title II) $ 192 M • Safe & Drug Free Schools (Title IV) $ 70 M • Career & Technical $ 60 M • Bilingual (Title III) $ 40 M • Innovation (Title V) $ 14 M • Others $ 44 M • Total $3,353 M Note: $1,099 M is from ARRA Funds
State Funding • General State Aid – provide unrestricted grants-in-aid to Illinois school districts in an equitable manner. Foundation level formula and poverty grant formula. • The objective of categorical programs is to reimburse districts for the expense associated with providing services to or for targeted populations.
FY 2010 State Funding • GRF (40 + programs) • General State Aid / HH $4,616 M • Mandated Categoricals $1,927 M • Other $ 738 M Note: ARRA Funds Included are $790.7M for GSA and $146.6M for Early Childhood • Non-GRF • School Construction $ 149 M • School Infrastructure $ 5 M • Driver Education $ 18 M • Others $ 11 M • Total $7,464 M
Changes in FY 2010 • Foundation Level increased $160 ($6,119) $8M increase • Transitional Assistance - Eliminated • Fast Growth Grant – Eliminated • ADA Block Grant – Decreased by $56M (75%) • GSA Uses a More Current CPPRT (CY 2008) • Alternate Double Whammy Adjustment – GSA • Poverty Hold Harmless Started Phase-Out • GSA Hold Harmless Prorated at less than 50%
Mandated Categoricals • Lunch/Breakfast $ 26.3 M • Regular Orphanage $ 13.0 M • SE Extraordinary $ 334.2 M • SE Orphanage $ 120.2 M • SE Personnel $ 459.6 M • SE Private Tuition $ 181.1 M • SE Summer School $ 11.7 M • SE Transportation $ 429.7 M • Regular Transportation $ 351.1 M Total $1,926.9 M
Other Major Categoricals • Early Childhood $342.2 M • Reading Improvement $ 68.5 M • Bilingual Education $ 68.1 M • Career & Technical Education $ 38.6 M • Extended Learning Opportunities $ 20.7 M (Summer Bridges) • Standards, Assessment and Accountability $ 33.7 M • Alternative Learning $ 16.7 M
Local Funding(2006 EAV & Tax Rates) • Property Taxes $ 13,110 M • Debt Service $1,285 M • Education $8,974 M • Operations $1,528 M • Transportation $ 358 M • All Others $ 965 M • CPPRT $ 794 M Total $ 13,904 M
GSA vs. Property Taxes The Great Equalizer • The property taxes collected by Illinois school districts is less than one third of the amount that General State Aid has to attempt to equalize the funding disparities occurring throughout the State of Illinois. • Therefore the four billion in GSA cannot equalize the disparate effects of EAV, ADA, and local property tax collections in Illinois
Downstate Scenario • For every $1 Million increase to the EAV used to calculate GSA for a foundation district: • Unit Districts Lose $30,000 in GSA • Elementary Districts Lose $23,000 in GSA • High School Districts Lose $10,500 in GSA • Nearly all downstate school districts are experiencing this scenario and have for many years.
PTELL – “TAX CAPS” • Property Tax Extension Limitation Law • Referred to as “Tax Caps” • Limits the Amount the Extension can Increase over the Previous Year • Linked to the Consumer Price Index (CPI) • Legislated for Collar Counties(1991) Cook County (1994) • Limiting Rate X Total EAV = Extension • Maximum that a district can receive (no bonds)
PTELL Highlights Fiscal Year 2009 • 39 Counties Subject to PTELL (38%) • 460 (53%) Districts • 78% of the ADA • 63 Counties NOT Subject to PTELL (62%) • 9 - Failed Referendum • 54 – No Vote • 409 (47%) Districts • 22% of the ADA • Double Whammy Adjustment Cost - $806M (FY08)
Cause of Unequal Funding for Illinois Public Schools The primary cause of funding inequities in Illinois Public Schools is the disparate value of property within Illinois Public Schools. Local property taxes provide the majority of funding for Illinois Public Schools.
Power of EAV • To determine the amount of property taxes generated by a district, you need to drop the four last numbers of a districts EAV and the remaining number is the amount of tax dollars generated by a penny of property taxes in an individual district.
Example of Power of EAV District with an EAV of $25,256,676 would generate - $2,525 of property tax dollars for every of penny of property taxes. District with an EAV of $125,256,676 would generate - $12,525 of property tax dollars for every penny of property taxes. District with an EAV of $1,252,566,760 would generate - $125,256 of property tax dollars for every penny of property taxes. Therefore, disparate amounts of revenue are raised by Illinois Public School Districts with the same taxpayer paying the same penny of local property taxes.
EAV Highlights • 47.3% Increase • 53.7% Growth in Cook/Collar (80% of EAV) • 26.6% Growth in Downstate (20% of EAV) • 22 Counties (>35% increase) • 11 Counties Increased over 50% • 15 Downstate Counties Decreased
Downstate Scenario When districts have an increase in EAV and a concurrent decrease in ADA, the net effect is the worst possible formula entrance into the GSA formula.
ADA Highlights • 0.9% Increase • 1.1% Increase in Cook/Collar (66% ADA) • 8.7% Increase in Collar Counties (Cook County decreased by 4.1%) • 0.6% Increase Downstate (34% ADA) • 78 Counties Decreased • 14 Counties Decreased 10% or more
Statutory Requirements for EFAB • EFAB shall make recommendations … for the foundation level …and for the supplemental general state aid grant level … for districts with high concentrations of children from poverty. • The recommended foundation level shall be based on a methodology which incorporates the basic education expenditures of low-spending schools exhibiting high academic performance.
Contact Information William H. Phillips, Ed.D. Associate Professor – University of Illinois Springfield Email: phillips.william@uis.edu Phone: 618-558-7882 Please feel free to contact me for any questions.