Download
1 / 1
10 likes | 151 Views
SMMR Pathfinder. NSIDC. get_smmr_tbs. Wentz SSM/I. RSS. ssmidriver. AMSR-E Swath to Grid Toolkit. MSFC SSM/I. GHRC. hdftogs. AMSR-E L2a. NSIDC. amrstogs. Ken Knowles, Mary J. Brodzik, Matthew H. Savoie University of Colorado, Boulder, CO. http://nsidc.org/data/tools/.

E N D
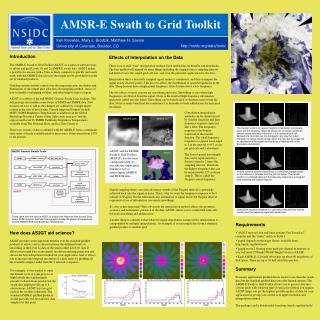
SMMR Pathfinder NSIDC get_smmr_tbs Wentz SSM/I RSS ssmidriver AMSR-E Swath to Grid Toolkit MSFC SSM/I GHRC hdftogs AMSR-E L2a NSIDC amrstogs Ken Knowles, Mary J. Brodzik, Matthew H. Savoie University of Colorado, Boulder, CO http://nsidc.org/data/tools/ NSIDC Generic Swath Tools generic swath The transfer function for nearest-neighbor interpolation is a square wave and the frequency response shows lots of energy outside the Nyquist critical frequency interval of +/-0.5 cycles per grid cell. Because the input data are not averaged in any way the output histogram of values should closely match the input but the image will be speckled and the shapes and locations of features will not be accurately represented. gsconcat (subset by time) gsgrid (resample to grid subset by area select overlapping orbits) AS2GT grid/map description (.gpd file) gridded brightness temperatures Inverse distance squared interpolation is a weighted average based on the distance of samples from the grid cell center. The transfer function is a dimpled spike and the frequency response is a single fat lobe extending well beyond Nyquist. Limiting the maximum distance to 1 grid cell shrinks both the transfer function and the frequency response's center lobe. These same tools are used at NSIDC to produce the Near-real time Ice and Snow Extent (NISE) product, the Polar Stereographic Gridded Brightness Temperatures, and the SMMR EASE-Grid Brightness Temperatures. How does AS2GT aid science? AS2GT provides some important benefits over the standard gridded products. It allows you to choose between the different levels of smoothing in the Level 2a data or the unsmoothed Level 1b data. It allows you to grid data at any spatial resolution and map projection and choose the best interpolation method for your application.And, it allows you to increase the temporal resolution of a time series by gridding all the available samples rather than the 2 selected overpasses. AMSR-E 36H MODIS Ch.1 AS2GT and the MODIS Swath to Grid Toolbox (MS2GT), use the same configuration files to describe the output grids making it easy to intercompare AMSR-E and MODIS data. For example, if you wanted to study the diurnal cycle of some process at high latitude the standard grids provide 2 observations per day but the swath data might provide up to 8 observations. AS2GT lets you grid each of the swathes separately. The standard AMSR-E gridded products would give only the first and last data samples for this point. NRTSI Introduction The AMSR-E Swath to Grid Toolkit (AS2GT) is a suite of software tools to subset and grid Levels 1b and 2a AMSR-E swath data. AS2GT makes it possible for anyone with a Unix or linux computer to quickly and easily work with the AMSR-E data in ways that might not be provided for in the set of standard products. Gridding options include control over the map projection, resolution, and dimensions of the output grid, selection of resampling method, choice of how to handle overlapping swathes, and subsetting by time or region. AS2GT is a subset of the full NSIDC Generic Swath Tools package. The full package also handles some forms of SSM/I and SMMR data. New formats are easy to add as the changes are confined to a single ingest routine at the start of processing. Current supported formats include: MSFC SSM/I Brightness Temperatures available from the Global Hydrology Resource Center at http://ghrc.msfc.nasa.gov/ and the reprocessed Level 1b SMMR Pathfinder Brightness Temperatures available from The National Snow and Ice Data Center at http://nsidc.org. These two sources of data combined with the AMSR-E form a continuous time series of freely available passive microwave observations from 1979 to the present. Effects of Interpolation on the Data There is no overall “best” interpolation method. Each method has its benefits and drawbacks. The best method will depend on many things including the original sensor sampling interval and field of view, the output grid cell size, and even the particular application for the data. Interpolation takes a discretely sampled signal, makes it continuous, and then resamples the signal at new discrete points. This process affects the distribution of spatial frequencies in the data. Sharp features have a high spatial frequency, fuzzy features have a low frequency. The two effects of most concern are smoothing and noise. Smoothing occurs when high frequencies are filtered from the signal. Noise is the result of high frequency information spuriously added into the signal. Smoothing can be beneficial if it eliminates noise from the data. Noise is rarely beneficial but sometimes it is desirable to trade added noise for increased resolution. Convolution interpolation methods can be characterized by transfer functions and their frequency response analyzed like a filter. The frequency response is the Fourier transform of the transfer function. The ideal frequency response is a square wave equal to 1 in the interval +/-0.5 cycles per grid cell and 0 elsewhere. The lowest spatial wavelength that can be represented in a discrete signal is 2 times the sampling interval. Therefore, the highest frequency that can be represented is 1/2 cycle per sample. This is called the Nyquist critical frequency. Digital sampling theory says that all energy outside of the Nyquist interval is spuriously reflected back into the signal as noise. This is why we want the frequency response to be 0 outside of Nyquist. On the other hand, any attenuation of signal inside the Nyquist interval represents a loss of information (too much smoothing). So, why is this important? Well, obviously the interpolation method affects the geometric accuracy and radiometric precision of the data. AS2GT allows you to control the trade-offs between smoothing and adding noise. Another thing to consider is that whatever signal degradation is imposed by interpolation is compounded by multiple interpolations, for example, if you resample data from a standard gridded product to another grid. • Requirements • AS2GT runs on Unix and linux systems.You’ll need a C compiler and the “make” utility to build it. • gsgrid depends on the mapx library available from: http://nsidc.org/data/tools/ • gsgrid stores 2 floating point grids per channel in memory so you will need 2*Nbands*Width*Height*4 bytes of RAM. • Each AMSR_E_L2A half orbit takes up about 80 megabytes of disk space. There are up to 30 half orbit files per day. Summary For many applications gridded data is easier to use than the swath data but the standard gridded data sets offer limited options. The AMSR-E Swath to Grid Toolkit allows you to process data into custom grids with whatever time or spacial resolution you require. AS2GT helps you get thehighest possible quality of data for your application by giving you control over inputresolution and interpolation method. The package can be downloaded from http://nsidc.org/data/tools/