Download
1 / 16
160 likes | 165 Views
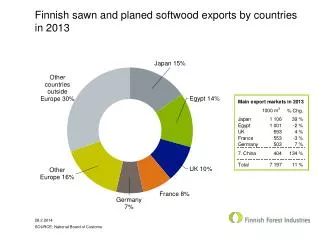
Sawn Softwood Markets. Mr. Andrey Benin General Director Concern Lemo St. Petersburg, Russia. Export gain of the leading countries - exporters of wood-paper production in 2001. $ mlrd. Canada. USA. Sweden. Finland. Russia.

E N D
Sawn Softwood Markets Mr. Andrey Benin General Director Concern Lemo St. Petersburg, Russia
Export gain of the leading countries - exporters of wood-paper production in 2001 $ mlrd Canada USA Sweden Finland Russia In 2000 Russia has supplied only 4,8% of global sawn timber producrion (20,25 mln m3 423 mln/m3)
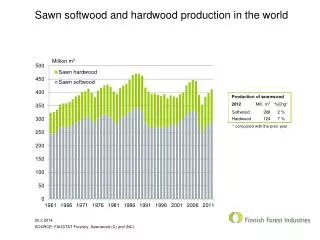
Country 1990 1995 2000 USA 109,8 105,3 114,3 Canada 54,9 60,4 67,4 China 23,2 27,4 23,4 Japan 29,8 23,8 22,1 Brasil 18,0 19,1 21,3 Sweden 12,0 14,9 19,7 India 17,5 17,4 17,9 Germany 14,7 14,1 16,6 Finland 7,5 9,5 11,9 France 11,0 9,8 11,6 Austria 7,5 7,8 9,1 Indonesia 9,1 6,6 6,1 Malaysia 8,8 8,4 5,7 Global production of sawn timber, mln. m3
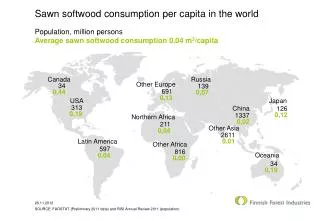
Country 2000 year Canada 49,24 Sweden 11,72 Finland 8,75 USA 5,93 Austia 5,00 Malaysia 3,02 Germany 2,1 Brasil 1,81 Chile 1,33 France 1,17 Norway 1,0 Belgium 0,73 Indonesia 0,60 China 0,52 Spain 0,24 Italy 0,11 Japan 0,01 Southern Korea 0,01 Export of sawn timber, mln. m3
Year Production, mln.m3 Export, mln.m3 Export share in the total volume of production, % 1990 75,02 15,7* 20,9 1995 26,46 5,9 22,3 1998 18,6 4,7 25,3 1999 19,1 6,4 33,5 2000 20,25 7,7 38,0 * - including CIS countries – 8 mln. m3 Dynamics of production and export of Russian sawn timber from 1990 to 2000
Branch December 2001 to december2000 December2000 to december1999 December 1999 to december1998 Industry 110,7 131,6 167,3 Mechanical engineering 116,5 128,0 149,6 Forest, woodworking and pulp&paper 107,7 124,6 167,7 Dynamics of price indexes, %
Dynamics of growth of sawn timber production in Sweden and Finland 25 20 3 15 mln. m 10 Sweden Finland 5 1990 1995 2000
Production of sawn timber 170 160 150 thousand m3 140 130 120 01.99 07.99 01.00 07.00 01.01 07.01 02.02
Equipment used for sawn timber production 80% Sawmill frames (one, -two - storeyd) 5,0% belt/sawing equipment 9,0% circulat/sawing equipment 6,0%milling equipment
Sawn timber production by regionsin % to total production volume in RF 23,3% Privolzskiy 13,2% Central 24,6% NorthWestern 9,8% Ural 1,2% Southern 3,0% Far-East 24,8% Siberian
Country Sawn timber Volume, % Cost,% TOTAL 100 100 Canada 43,1 47,7 Sweden 9,6 8,3 Finland 7,3 5,7 Russia 6,9 2,8 USA 5,4 8,3 Germany 2,0 1,8 France 1,1 1,2 Others 24,6 24,5 The share of Russia in the global export of sawn timber on its volumes and cost
Country Years 1998 1999 2000 Russia, total 116,2 97,4 94,4 1. Sweden 153,2 125,9 85,4 2. Finland 77,6 65,4 66,4 3. Norway 112,3 92,6 87,7 4. Great Britian 151,7 128,3 107,4 5. Germany 130,9 108,9 90,2 6. France 149,7 128,8 103,1 7. Belgium 148,5 123,1 102,4 8. Denmark 135,9 132,1 107,0 9. Poland 169,5 107,5 76,7 10. Austria 113,6 106,2 97,2 11. Netherlands 132,1 124,5 105,9 12. Baltic countries, total 72,4 54,9 60,6 Including: Latvia 92,6 55,5 59,8 Lithuania 66,7 56,8 66,5 Estonia 60,3 51,7 55,2 Total in the countries of North and West Europe 123,7 100,2 89,3 Dynamics of export prices for Russian sawn timber, $/м3
Share of republics, areas and cities included in NW Federal district in the total sawn timber production Subject of federal district The share in the sawn timber production, % From all-Russian production From production in NW Federal district North-West federal district total Including: 24,6 100 Arkhangelsk area 9,2 37,3 Republic Kareliya 3,7 15,1 Republic Komi 3,5 14,5 Vologda area 3,4 13,9 Novgorod area 1,8 7,5 Leningradarea 1,7 6,9 Pskovarea 0,8 3,1 St. Petersburg 0,2 0,7 Murmansk area 0,2 0,6 Kaliningradarea 0,1 0,4
Exporter Export volumes 2002,thousand м3 Region Arkhangelsk area 1241,6 NorthWestern Republic Karelia 594,2 NorthWestern St. Petersburg 387,5 NorthWestern Moscow 284,5 Central The largest territorial exporters of sawn timber in RF
30 27 Peter Woodbridge & Associates Ltd. 19 OSB 18 20 15 BN SF 3/8ths 10 PLYWOOD 0 1999 2000 2001 2002 Source RISI April 2001 2003 2004 2005 Structural Forecasts Indicate that OSB will Continue to Gain Market Share
Material balance Timber harvesting Wastes(wood felling residues) Sawlogs Pulpwoods Aspen Sawmillcamplex Panelproduction Chips«white» OSB-panels Wastes(bark,shaving,cuttings) Wastes(bark) Board Profoundprocessing Pulp&paper mill House building facilitymultiprofile construction Power engineeringProduction of useful heat & electric power Production(qualitative board,profiles) Wastes