Download
1 / 1
10 likes | 112 Views
Soft-hard-soft spectral evolution at RHESSI resolution H.S. Hudson 1 , B. Dennis 2 , S. R. Kane 1 , R. P. Lin 1 , J. McTiernan 1 , R. Schwartz 3 , and D. Smith 1 1 UC Berkeley; 2 GSFC; 3 Raytheon ITSS/LASP, GSFC. Introduction

E N D
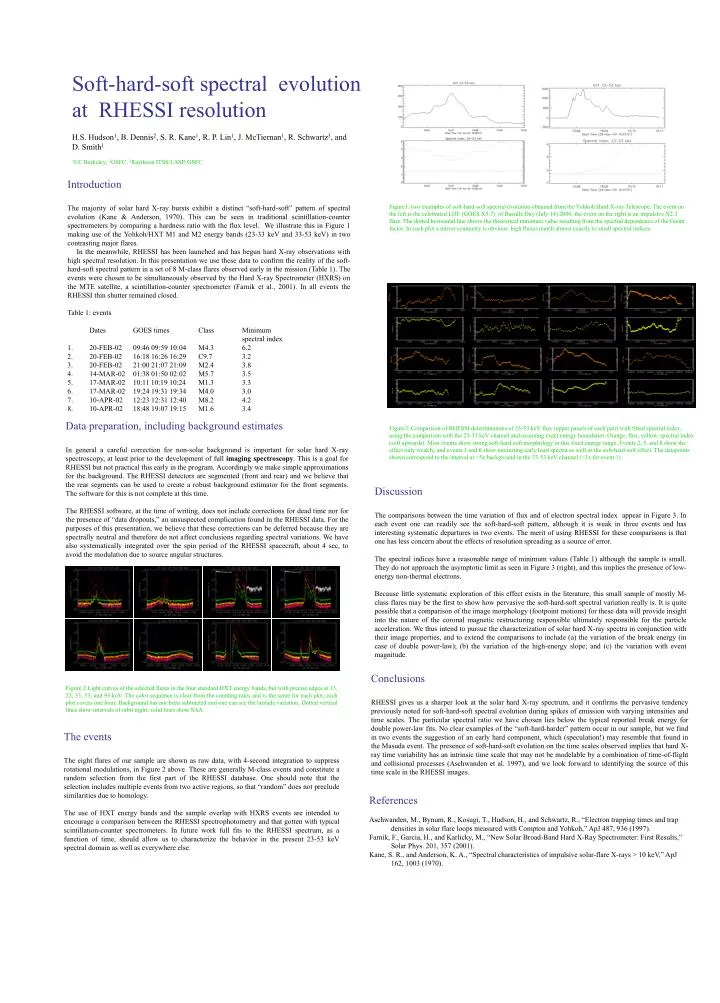
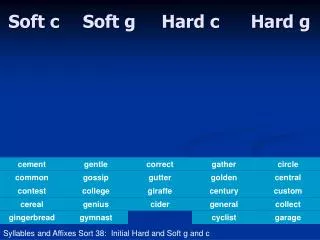
Soft-hard-soft spectral evolution at RHESSI resolution H.S. Hudson1, B. Dennis2, S. R. Kane1, R. P. Lin1, J. McTiernan1, R. Schwartz3, and D. Smith1 1UC Berkeley; 2GSFC; 3Raytheon ITSS/LASP, GSFC Introduction The majority of solar hard X-ray bursts exhibit a distinct “soft-hard-soft” pattern of spectral evolution (Kane & Anderson, 1970). This can be seen in traditional scintillation-counter spectrometers by comparing a hardness ratio with the flux level. We illustrate this in Figure 1 making use of the Yohkoh/HXT M1 and M2 energy bands (23-33 keV and 33-53 keV) in two contrasting major flares. In the meanwhile, RHESSI has been launched and has begun hard X-ray observations with high spectral resolution. In this presentation we use these data to confirm the reality of the soft-hard-soft spectral pattern in a set of 8 M-class flares observed early in the mission (Table 1). The events were chosen to be simultaneously observed by the Hard X-ray Spectrometer (HXRS) on the MTE satellite, a scintillation-counter spectrometer (Farnik et al., 2001). In all events the RHESSI thin shutter remained closed. Table 1: events Dates GOES times Class Minimum spectral index 1. 20-FEB-02 09:46 09:59 10:04 M4.3 6.2 2. 20-FEB-02 16:18 16:26 16:29 C9.7 3.2 3. 20-FEB-02 21:00 21:07 21:09 M2.4 3.8 4. 14-MAR-02 01:38 01:50 02:02 M5.7 3.5 5. 17-MAR-02 10:11 10:19 10:24 M1.3 3.3 6. 17-MAR-02 19:24 19:31 19:34 M4.0 3.0 7. 10-APR-02 12:23 12:31 12:40 M8.2 4.2 8. 10-APR-02 18:48 19:07 19:15 M1.6 3.4 Figure1: two examples of soft-hard-soft spectral evolution obtained from the Yohkoh Hard X-ray Telescope. The event on the left is the celebrated LDE (GOES X5.7) of Bastille Day (July 14) 2000; the event on the right is an impulsive X2.3 flare. The dotted horizontal line shows the theoretical minimum value resulting from the spectral dependence of the Gaunt factor. In each plot a mirror symmetry is obvious: high fluxes match almost exactly to small spectral indices. Data preparation, including background estimates In general a careful correction for non-solar background is important for solar hard X-ray spectroscopy, at least prior to the development of full imaging spectroscopy. This is a goal for RHESSI but not practical this early in the program. Accordingly we make simple approximations for the background. The RHESSI detectors are segmented (front and rear) and we believe that the rear segments can be used to create a robust background estimator for the front segments. The software for this is not complete at this time. The RHESSI software, at the time of writing, does not include corrections for dead time nor for the presence of “data dropouts,” an unsuspected complication found in the RHESSI data. For the purposes of this presentation, we believe that these corrections can be deferred because they are spectrally neutral and therefore do not affect conclusions regarding spectral variations. We have also systematically integrated over the spin period of the RHESSI spacecraft, about 4 sec, to avoid the modulation due to source angular structures. Figure3: Comparison of RHESSI determinations of 33-53 keV flux (upper panels of each pair) with fitted spectral index, using the comparison with the 23-33 keV channel and assuming exact energy boundaries. Orange, flux; yellow, spectral index (soft upwards). Most events show strong soft-hard-soft morphology in this fixed energy range. Events 2, 5, and 8 show the effect only weakly, and events 3 and 6 show interesting early hard spectra as well as the soft-hard-soft effect. The datapoints shown correspond to the interval at >5x background in the 33-53 keV channel (>3x for event 1). Discussion The comparisons between the time variation of flux and of electron spectral index appear in Figure 3. In each event one can readily see the soft-hard-soft pattern, although it is weak in three events and has interesting systematic departures in two events. The merit of using RHESSI for these comparisons is that one has less concern about the effects of resolution spreading as a source of error. The spectral indices have a reasonable range of minimum values (Table 1) although the sample is small. They do not approach the asymptotic limit as seen in Figure 3 (right), and this implies the presence of low-energy non-thermal electrons. Because little systematic exploration of this effect exists in the literature, this small sample of mostly M-class flares may be the first to show how pervasive the soft-hard-soft spectral variation really is. It is quite possible that a comparison of the image morphology (footpoint motions) for these data will provide insight into the nature of the coronal magnetic restructuring responsible ultimately responsible for the particle acceleration. We thus intend to pursue the characterization of solar hard X-ray spectra in conjunction with their image properties, and to extend the comparisons to include (a) the variation of the break energy (in case of double power-law); (b) the variation of the high-energy slope; and (c) the variation with event magnitude. Conclusions RHESSI gives us a sharper look at the solar hard X-ray spectrum, and it confirms the pervasive tendency previously noted for soft-hard-soft spectral evolution during spikes of emission with varying intensities and time scales. The particular spectral ratio we have chosen lies below the typical reported break energy for double power-law fits. No clear examples of the “soft-hard-harder” pattern occur in our sample, but we find in two events the suggestion of an early hard component, which (speculation!) may resemble that found in the Masuda event. The presence of soft-hard-soft evolution on the time scales observed implies that hard X-ray time variability has an intrinsic time scale that may not be modelable by a combination of time-of-flight and collisional processes (Aschwanden et al. 1997), and we look forward to identifying the source of this time scale in the RHESSI images. Figure 2 Light curves of the selected flares in the four standard HXT energy bands, but with precise edges at 13, 23, 33, 53, and 93 keV. The color sequence is clear from the counting rates and is the same for each plot; each plot covers one hour. Background has not been subtracted and one can see the latitude variation. Dotted vertical lines show intervals of orbit night; solid lines show SAA. The events The eight flares of our sample are shown as raw data, with 4-second integration to suppress rotational modulations, in Figure 2 above. These are generally M-class events and constitute a random selection from the first part of the RHESSI database. One should note that the selection includes multiple events from two active regions, so that “random” does not preclude similarities due to homology. The use of HXT energy bands and the sample overlap with HXRS events are intended to encourage a comparison between the RHESSI spectrophotometry and that gotten with typical scintillation-counter spectrometers. In future work full fits to the RHESSI spectrum, as a function of time, should allow us to characterize the behavior in the present 23-53 keV spectral domain as well as everywhere else. References Aschwanden, M., Bynum, R., Kosugi, T., Hudson, H., and Schwartz, R., “Electron trapping times and trap densities in solar flare loops measured with Compton and Yohkoh,” ApJ 487, 936 (1997). Farnik, F., Garcia, H., and Karlicky, M., “New Solar Broad-Band Hard X-Ray Spectrometer: First Results,” Solar Phys. 201, 357 (2001). Kane, S. R., and Anderson, K. A., “Spectral characteristics of impulsive solar-flare X-rays > 10 keV,” ApJ 162, 1003 (1970).


![Hard [numbers, plans] is Soft. Soft [people/relationships] is Hard.](https://cdn5.slideserve.com/9586948/when-i-was-in-medical-school-i-spent-hundreds-dt.jpg)