Download
1 / 27
300 likes | 509 Views
Chapter 9 Capability and Rolled Throughput Yield. What is capability analysis? And what can it tell us?. Measuring Capability. Measure the true quality levels of products and services.

E N D
Measuring Capability • Measure the true quality levels of products and services. • Report the relationship between what is acceptable to the customer and what the process can naturally deliver. • Process Capability – is defined as the spread within which almost all of the values of a data distribution will fall. (Generally described as 6s or 3s) • The main objective of 6s is to have no more than 3.4 defects per million opportunities (DPMO). • The process must be brought into statistical control so that performance becomes predictable and capable of consistently meeting customer expectations.
What is a normal distribution? -6 -5 -4 -3 -2 -1 0 1 2 3 4 5 6 www.barringer1.com/jan98f1.gif
So what is Capability? • The proportion of output that will be within product specification tolerances. Specification Range Usually set by customer LSL Lower Specification Limit USL Upper Specification Limit Process Range
How is capability measured? Cp>=1 process capable Cp<1 process not capable Cp= 1.33 minimum value for process to be considered capable*. *Most organizations use 1.33 as the minimum due to the shift that occurs over time We have a lower sigma for long-term than short-term since long-term process capability is expected to shift over time by 1.5s. 6s-1.5s = 4.5s 3.4 DPMO answer to HW #1
Indices of Capability - Cp USL Upper Specification Limit LSL Lower Specification Limit Cp<1 Cp= 1 Cp= 1.5 Cp= 2.0 Improvement
Capability ExampleExample 9.1 • CALCULATE the Cp • Process has a mean = .738 • s=.0725 • LSL=.500, USL=.900 Isthis process capable? Why?
Cp is missing a key element • Cpk was created to address instances when the process mean is not centered relative to the specification limits. It only really makes sense when the process remains centered. Specification Range LSL USL Process Range
Indices of Capability - Cpk Potential Real Capability Capability USL LSL Cp= 2.0 Cpk=2.0 Cp= 2.0 Cpk=<1 Cp= 2.0 Cpk= 0 Cp= 2.0 Cpk< -1 Increase in rejects
How can we calculate Cpk ? m = process center = short-term standard deviation m = midpoint of specification • MINITAB • STAT • QUALITY TOOLS Capability Analysis
You can’t improve what you don’t measure? But what characteristics do Six Sigma metrics have? METRIC: • Must have a scale • Must have a goal, or standard • Compensation or other forms of recognition must be attached to actual performance compared to goal. • The metric is reported and reviewed vertically and horizontally throughout the organization on a regular basis. • The metric must be able to be pooled horizontally and vertically within the enterprise. • The metric must be strongly correlated with one or more of the 12 dimensions of quality at the business, operations, and/or process level of the organization.
What defects are we measuring? And what’s the difference? • Unit = item, service, product, transaction delivered to customer. • Defect = failure to meet customer req. or a performance standard • Defective = unit that contains at least one defect • Defect opportunity = opportunities for a unit to be defective • With DPMO, look up Long-term and Short-term Sigma in the Sigma Conversion Table (Table VIII in Appendix A)
DPU/ DPMOExample 9.4 • Bank branch receives 300 mortgage applications per business day. • Report shows that these applications contained 50 defects. • Each application as 14 key fields (defect opportunities). Calculate the DPU, DPO and Sigma Level: Look up 11,904.76 in the Sigma Conversion Table (Table VIII in appendix) What is the range for the Short-term and Long-term Sigma?
DPU/ DPMO Example 9.7 • Office receives 4500 engineering permit applications per day. • Audit shows that these applications contained 300 defects. • Each application as 12 key fields (defect opportunities). Calculate the DPU, DPO and Sigma Level: Look up 5,555.56in the Sigma Conversion Table Short-term sigma = 4s- 4.1s Long-term sigma = 2.5s - 2.6s
Capability vs. Performance • For indicating the level of long-term performance that a process can achieve we use:
Equivalent Mean Offset Long-Term Performance LSL USL Short-Term Capability USL LSL 1.5
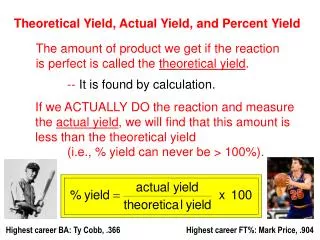
What is meant by yield? • “Yield” can be viewed as the ratio of output to input: • A successful unit would mean it is free of any type on nonconformity (or defect). • EXAMPLE: Process 100 units, 90 are successful. • Called FTY (Final Test Yield)
But…yield is a flawed conceptIt doesn’t account for rework and replacement • We must look at a process map and measure IPY (In Process Yield) at each step. • RTY (Rolled Throughput Yield) is calculated by multiplying together they IPY. RTP = IPY1 x IPY2 x IPY3 x…x IPYn • This could be considered a true assessment of process effectiveness.
Example of Yield vs. RTY START • Bank with 280 deposits a day. Each slip as 5 defect opportunities. They get a lot of complaints, but they can’t understand why since the # of defects per final confirmation is low. Customer gives deposit slip . FIRST: create a flow chart Bank associate processes deposit Enters deposit in electronic system System generates deposit confirmation Customer obtains confirmation END
Example of Yield vs. RTY START SECOND: Note the defects per step, and calculate the DPU, IPY for each. IPY = e-DPU Since there are multiple defect opportunities per unit. Customer gives deposit slip . Bank associate processes deposit Enters deposit in electronic system System generates deposit confirmation Customer obtains confirmation END
Example of Yield vs. RTY START SECOND: Note the defects per step, and calculate the DPU, IPY for each. IPY = e-DPU Since there are multiple defect opportunities per unit. Customer gives deposit slip . Bank associate processes deposit Enters deposit in electronic system System generates deposit confirmation Customer obtains confirmation END
The Hidden Factory START • The hidden factory is used to designate all work performed above and beyond to produce a good unit of output and is not explicitly identified. Can include the costs for rework, scrap, excess floor space and equipment. • Estimated that 30% of an organization’s resources go to the hidden factory. Customer gives deposit slip . Rework Rework Rework Rework Rework Failure Analysis Failure Analysis Failure Analysis Failure Analysis Failure Analysis Inspection Inspection Inspection Inspection Inspection Bank associate processes deposit Enters deposit in electronic system System generates deposit confirmation Customer obtains confirmation END