Download
1 / 41
440 likes | 800 Views
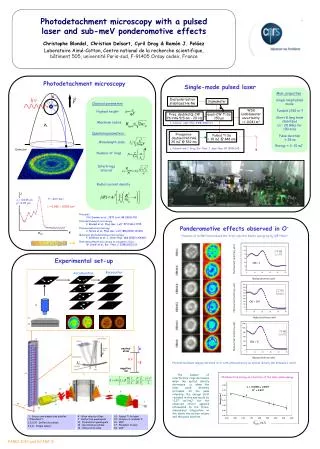
GC Triple Quadrupole MS: A Versatile Tool for POPs. David Steiniger Senior Applications Scientist April 11, 2013. POP’s analysis. POPs analysis consists of:. • Polychlorinated dibenzo -p-dioxins (PCCDs) • Polychlorinated dibenzofurans (PCDFs) • Polychlorinated biphenyls (PCBs)

E N D
GC Triple Quadrupole MS: A Versatile Tool for POPs David Steiniger Senior Applications Scientist April 11, 2013
POPs analysis consists of: • Polychlorinated dibenzo-p-dioxins (PCCDs) • Polychlorinated dibenzofurans (PCDFs) • Polychlorinated biphenyls (PCBs) • Toxaphenes • Organochlorine pesticides (OCPs) • Perfluorinated compounds • Brominated flame retardants (BFRs) • Chlorinated paraffins
GC-MS triple quad portfolio • Thermo Scientific™ TSQ 8000™ GC/MS • High performance “workhorse” in routine complex matrix and for method consolidation • Thermo Scientific TSQ Quantum™ XLS Ultra GC/MS • Ultimate performance for high end applications • Emerging contaminants
GC-MS/MS – What’s so special? • Low detection limits • Optimized sample preparation • Consolidated analytical methods • Faster, automated data processing ...it’s a high selectivity technique...
Inside the TSQ 8000 3rd Quadrupole “Q3” 1st Quadrupole “Q1” Ion Source 2nd Quadrupole “Q2” Collision Cell Dynode and Electron Multiplier Ion Guide
Step 1: Precursor ion selection Selected analyte precursor ion Matrix ion with same mass number
Step 1: Precursor ion selection Acibenzolar-S-Methyl – 10 ppb in Lettuce Significant contribution from matrix ion causes peak area to be too high
Step 2: Fragmentation in collision cell Fragmentation of both analyte and matrix ion
Step 3: Product ion selection Selection of unique product ion of analyte
Step 3: Product ion selection m/z 182 m/z 153 SRM removes the shoulder from matrix interference & reduces background SRM on m/z 182 > 153 SIM on m/z 182
PCDD/Fs environmental samples • Presented is the determination of PCDD/Fs in sediments, soils, bottom and fly ash (as incineration by-products) using GC-MS/MS. • During this study, instrumental LOQs using GC-MS/MS were calculated in the low fg/µl concentration ranges. This and further analytical performance is discussed alongside GC-HRMS; especially degree of agreement between the techniques in some routine sample batches.
Extraction and clean-up • The standard spiking protocols, and the extraction and clean-up process for all sediment and soil samples were performed using an in-house variation of EPA 1613B. For incinerator ash samples an in-house method based upon EN 1948 was applied. • For both of these methods accelerated solvent extraction (ASE) was used as the preferred technique for extraction after initial sample processing.
GC-MS/MS measurement • TSQ Quantum XLS Ultra GC-MS/MS
PCDD EPA1613 CS1 (diluted 10x) 2,3,7,8-TCDD 100fg 1,2,3,7,8 PeCDD 500fg 1,2,3,7,8,9-HxCDD 1,2,3,4,7,8-HxCDD 500fg 1,2,3,6,7,8-HxCDD 1,2,3,4,6,7,8-HpCDD 500fg OCDD 1000fg
TCDD in different environmental samples 321.9>258.9 321.9>258.9 321.9>258.9 2,3,7,8-TCDD 2,3,7,8-TCDD 2,3,7,8-TCDD 319.9>256.9 319.9>256.9 319.9>256.9 Fly Ash Contaminated Soil Contaminated Sediment
GC-MS/MS - comparison of calculated results for soils/sediment
Sensitivity driven by precision Fivefold repeated injection of same sample extract of mixed animal fat 319.9 > 256.9 100 fg 2,3,7,8-TCDD on column • Mean : 0.13 pg/g fat • CV: 12.5 % 321.9 > 258.9 13C TCDD 1,2,3,4 & 2,3,7,8
Solid ion ratios for high confidence QC limits around the theoretical ion abundance ratios: ± 15 % • HyperQuad ion ratio performance against theoretical values for dioxins • Solid performance well within EU guidelines • This in combination with excellent instrument sensitivity allows good quality WHO-TEQ values to be determined.
TSQ Quantum XLS Ultra – food dioxin screening • Courtesy Alexander Kotz, EURL Freiburg, Germany • Presented at the 6th POPs Users Meeting, Niagara-on-the-Lake, Canada, Apr 28/29, 2011
SCCPs chromatogram in full scan mode Short Chain Chlorinated Paraffinsdo not elute in separate peaks, but as a range of isomers The calculation is performed by integrating a time range, not integrating individual peaks.
Linearity and peak at lowest level of calibration curve R2= 0.9956 At 0.5 ng the peak is still abundant in area and can be integrated easily
Mixed halogenated dioxins • Routine monitoring not yet in place • 2,3,7,8 substituted congeners are suggested to be even more toxic than their chlorinated analogues • In order to understand sources, fate, and distribution in the environment; low level analytical techniques must be utilized
Mixed halogenated dioxins – method overview • Soil samples were solvent extracted using toluene • The TSQ Quantum XLS Ultra GC-MS/MS system was installed with a TR-PCB 8MS (60 m × 0.25 mm) • Injector SSL: 280 ⁰C • Flow: 1.2 ml/min • Injection volume: 1 µL
PXDD/Fs at 2.4 pg/µL in soil extract Good low level precision in matrix with good LOD (1 µL on column)
House dust sample in NCI (above) and EI-SRM (below) showing BDE47 at a level of 0.07 ppb
House dust sample in NCI (above) and EI-SRM (below) showing BDE183 at a level of 0.17 ppb
In conclusion • Triple quad is a great tool for a wide range of compounds • Provides improved selectivity over other instrumentation • Better signal to noise ratios – lower detection limits • Eliminates matrix interferences through SRM • Combine several methods into one run
Acknowledgements • Thermo Scientific Team: • Inge de Dobbeleer • Paul Silcock • Joachim Gummersbach • Dwain Cardona • Valued Collaborators: • Chris Hunter, John Fardon and David Gardner, UK Environment Agency • Eric Reiner, Ministry of Environment, Canada