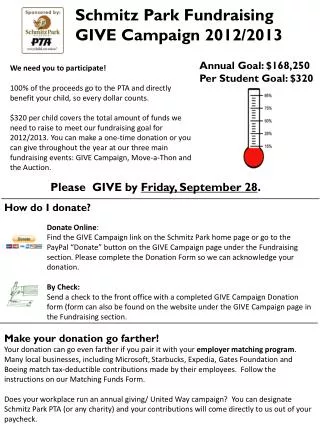
Download
1 / 4
40 likes | 151 Views
We need to assess sensitivity to assumptions. What drives the figures? How sensitive are they to basic inputs?. We need to assess sensitivity to assumptions. What drives the figures? How sensitive are they to basic inputs?. Building the sensitivity table. Building the sensitivity table.

E N D
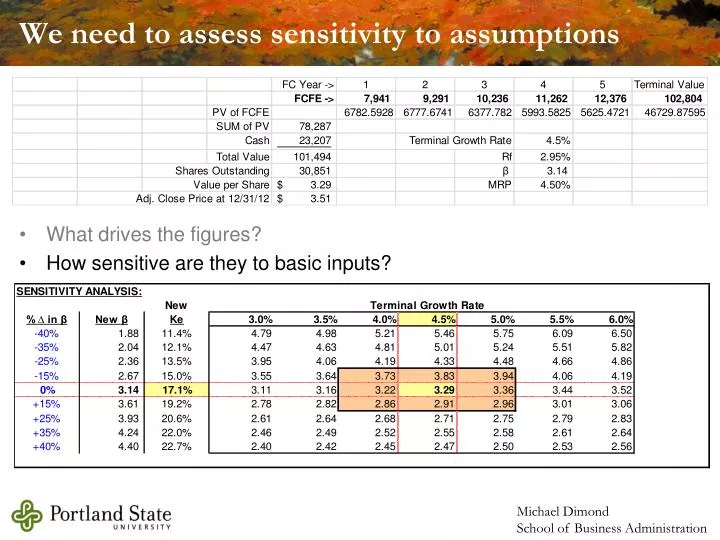
We need to assess sensitivity to assumptions • What drives the figures? • How sensitive are they to basic inputs?
We need to assess sensitivity to assumptions • What drives the figures? • How sensitive are they to basic inputs?
Building the sensitivity table What’s in the yellow cell in the middle of the table? (easier to click cells than type references) = ( NPV( $E265, $H$245, $I$245, $J$245, $K$245, $L$245+ ($L$245*(1+I$260)/($E265-I$260)) ) +$G$248) /$G$250 You should be able to paste the foumula into the remaining cells in the table and get the correct results. equals group everything together PV of cash flows Ke from the sensitivity table CF1 CF2 CF3 CF4 CF5 plus… terminal value, using %s in table close the NPV function add the cash divide by the number of shares