Download
1 / 52
520 likes | 799 Views
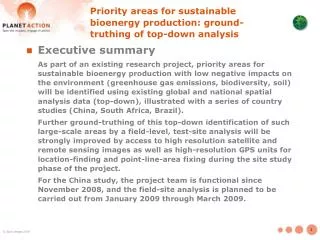
Ground truthing of LEAP intermediate outputs with particular emphasis on WRSI and Yield Reduction predictions. Mathewos Hunde And Dr. Girma Mamo FSCB/WFP Workshop 21 January 2008. Outline . Purpose of index verification exercise Area selected for index verification exercise

E N D
Ground truthing of LEAP intermediate outputs with particularemphasis on WRSI and Yield Reduction predictions Mathewos Hunde And Dr. Girma Mamo FSCB/WFP Workshop 21 January 2008
Outline Purpose of index verification exercise Area selected for index verification exercise Agencies participated in the verification exercise Types of LEAP derived outputs selected for verification exercise Verification methodology Verification results and discussions Conclusions and recommendations
Purpose of index verification exercise To ascertain the capability of the LEAP index as monitoring and early warning tool in agriculture and food security To Verify individual input data of the index (planting dekad, sowing window, LCc etc) To identify improvement areas and generate baselines for further improvement of the index
Team arrangement Team 1: Parts of Amhara & TigrayTeam 2: Parts of Oromia, B/Gumuz and GambellaTeam 3: Parts of Oromia, Somali and AfarTeam 4: Parts of Oromia, Southern Region 3rd to 27th of December 2007
Agencies participated in the verification exercise WFP MoARD NMA EIAR OBoARD WOoARD
Types of LEAP derived outputs selected for verification exercise Rainfall Moisture Index WRSI YR
Rainfall distribution for November 2007 by Zone 1st Dekad (1-10)
Actual (2007) dekadal rainfall distribution versus average (1995-2006) for November by Zone Below average Above average 1st Dekad (1-10)
Dekadal Moisture Index for June to October 2007 by Zone 3rd Dekad (21-31)
Water Requirement Satisfaction index (WRSI) for Maize in 2007
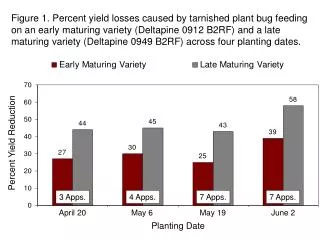
Percent Yield Reduction in relation to maximum yield for Maize in 2007 Meher cropping season
Verification methodology Data collection Average (normal) and actual (2007) rainfall variables start of season (SOS), end of season(EOS), season duration, dry spells other natural hazards (flood, hail, frost) Time series data on crop area & production Water and pasture availability for livestock Animal body conditions and health status Grain and livestock prices Other inputs (fertilizer, pesticides & herbicides, credit) Number of affected people
Methodology … Dekadal rainfall maps and raw data Seasonal water requirement satisfaction index (WRSI) Moisture index Yield reduction data by crops Concurrent data from VAM/WFP, Country Office Rainfall alone does not reflect the reality
Methodology … Wereda Bureau of Agriculture Wereda Disaster Prevention & Preparedness Key informants Focused group discussion Surrounding farmers experience Selected fields Actual data from:
Methodology … LEAP yield prediction= Ym-(Ym*YR/100) Where:Ym= maximum yield (Q/ha) YR= Yield reduction (%) Yield reduction =100-((1-(1-WRSI)*Ky)*100) Where:WRSI= Water requirement satisfaction index (%) Ky= Crop response factor (to stress) WRSI: < 50% complete crop failure 51-75% moderately adequate > 75% Adequate Input data update for further improvement of the index (SOS, EOS, dry spells, SWHC, Ky, Kc) Report synthesis Data analyses and synthesis report
Result and Discussion Part I. Comparison of actual (2007) and LEAP generated seasonal rainfall performance by test weredas
Table 1: Comparison of actual (2007) and LEAP generated seasonal rainfall performance by test weredas
Summary of seasonal rainfall performance by test weredas Seasonal rainfall performance during the 2007 was generally favorable (SOS, amount, distribution & duration) including the risky areas. This was fairly consistent with the index output. Disparity between the observed and the LEAP products for all the cardinal rainfall variables was not so wide. Eg.1, Goncha Siso Enese reveals such a reality, where both the actual observation and the model prediction exactly concurred. E.g. 2,Kuyu.
Comparison of actual (2007) and LEAP … For Ginir and Kalu the actual observation revealed an extension of the growing season, while the model did not capture this event. Wider dissimilarity was observed for Konso, where the actual observation on the SOS, EOS and duration mismatched the model out put.
Result and Discussion … Part II. Comparison of average and actual (2007) production and area planted to crops in test weredas
Comparison of average and actual (2007) production and area planted to crops in test weredas Over all, the actual area and production data of the dominant food security crops have increased over the average and that was also fairly captured by LEAP during the year 2007 in all test weredas Maize area and production increase (Sokoru, Kuyu, Miesso, Guba Lafto) Wheat area and production increase (Sokoru, Kuyu, ATJK, Ginir, Kalu, Angolela Tera, Goncha Siso Enese, Arba Minch and Endrta) Sorghum area and production increase (Miesso, Kalu, Goncha, Guba Lafto, Habru, Raya-Azebo, Assosa, Dire Dawa) Teff area and production increase (Kuyu, ATJK, Habru, Kola Temben, Enderta, Raya-Azebo)
Kuyu Sokoru
Miesso Adami Tulu Jido Kombolcha
Kalu Ginir
Angolela Tera Guba Lafto
Habru Goncha Siso Enese
Konso Shebedino
Arbaminch Sodo Zuria
Enderta Kola Temben
Asossa Raya Azebo
Result and Discussion… Part III. Agreement between actual (2007) and LEAP predicted yield (Q/ha) under the 2007 meher season WRSI
Table 2: Summary of Agreement between actual (2007) and LEAP predicted yield (Q/ha) under the 2007 meher season WRSI : an example Wereda Dominant crops WRSI (%) in meher season Range of actual yield in 2007 (Q/ha) Range of LEAP predicted yield in 2007 (Q/ha) Deviation Remark Adami Tulu Jido Komolcha Sorghum, teff, maize, wheat, barley, haricot bean 92-100 10 for teff to 44 for maize 8.9 for teff to 28.1 for maize LEAP model under estimated actual sorghum yield by 78% and over estimated wheat yield by 44.3% The closer the actual and the predicted yields strong agreement, Miesso Sorghum, teff, maize, sesame 67-100 4.4 for teff to 14.7 for maize 5.5 for maize to 7.1 for sorghum LEAP under estimated actual maize yield by 164.7% and overestimated teff yield by 28.3% Konso Maize, teff, haricot bean, sorghum and chick pea 98-100 Closer agreement between the two
Table 3: Summary of grouping of the overestimated and underestimated 2007 yields of dominant meher crops in test weredas Wereda Dominant crop LEAP under estimated (%) LEAP over estimated (%) Remark Sokoru Wheat - 90.3 Closer agreement in 32% of the weredas, overestimated in 16% and underestimated in 32% of the werdas Adami Tulu Jido Kombolcha Wheat - 44.3 Sorghum 77.6 - Sodo Zuria Irish Potato - 87.5 - Wheat 167 Sweat potato 1506 - Arba Minch Sweat potato - 78.1 Horse bean 166 Haricot bean 127 Kuyu Teff 132.8 wheat 135.5 Sorghum 414.6 Miesso Maize 164 Kola Temben Sorghum 115 Enderta Wheat 171.5 Lentil 269.5 Dire Dawa Maize 207 Sorghum 81 Assossa Maize 138.7
Kuyu Sokoru
Miesso Adami Tulu Jido Kombolcha
Kalu Ginir
Angolela Tera Guba Lafto
Habru Goncha Siso Enese
Konso Shebedino
Arbaminch Sodo Zuria
Enderta Kola Temben
Asossa Raya Azebo
Summary on agreement of actual and predicted yield of 2007 About 52% in agreement About 16% overestimated About 32% underestimated Possible reasons for disparity are: Quality of data provided (area, production, yield) Individual data inputs used in the index (Sowing window, LGP, Crop basket weight (%) etc)
Conclusion and recommendation Seasonal rainfall performance during the 2007 was generally favorable (SOS, amount, distribution & duration) including the risky areas. This was consistent with the index output. Generally, the index has reasonably captured the actual production/yield level, but further improvement is needed enhance its capability. This means that the index can be used for crop monitoring and early warning purpose And thus the government particularly MoARD should take the lead in incorporating the tool into the EWS