Download
1 / 24
250 likes | 473 Views
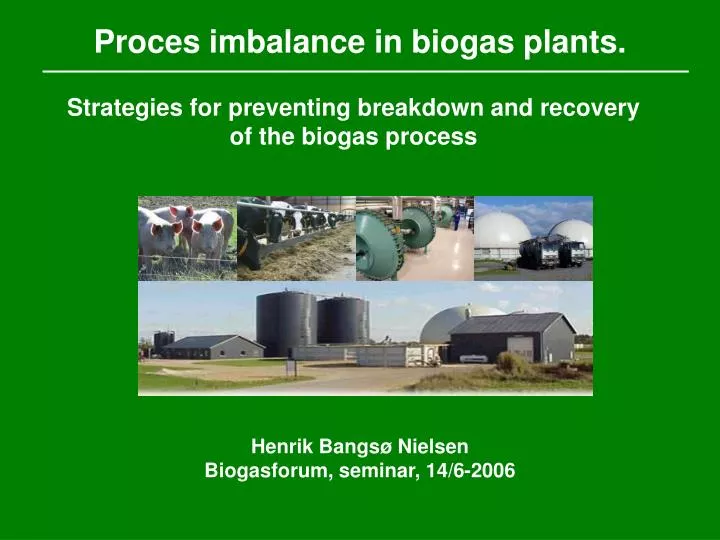
Proces imbalance in biogas plants. Strategies for preventing breakdown and recovery of the biogas process. Henrik Bangsø Nielsen Biogasforum, seminar, 14/6-2006. Outline. Project strategy Resume of last presentation (29-11-05) Follow up on last presentation

E N D
Proces imbalance in biogas plants. Strategies for preventing breakdown and recovery of the biogas process Henrik Bangsø Nielsen Biogasforum, seminar, 14/6-2006
Outline • Project strategy • Resume of last presentation (29-11-05) • Follow up on last presentation • Digestion of blood (Lemvig biogas plant) • Ongoing experiments: • Process recovery following ammonia and lipid inhibition • Comments from the audience ?
A B Visits at biogas plants Data collection C Experiments and results that can be 1) directly related and used by specific plants and 2) can be published Overall project strategy
A: Visits at biogas plants • Main conclusions: • “No problems” • Pre-storage tanks are not useful • Substrate composition is unknown • Substrate degradation characteristics is unknown • Inadequate surveillance, especially with regard to VFA
Foaming starts april 2003 Foaming ends march 2005 B: Data collection
C: Experiments and results • Pre-storage tanks are not useful: Plant constructors • Substrate composition is unknown and substrate degradation characeristics is unknown: • E and R: Screening of various wastes with regard • toxicity and biogas potential. Establishment of waste index. • Inadequate surveillance, especially with regard to VFA E and R: VFA surveillance and development of VFA sensors
Follow up on last presentation Digestion of blood at Lemvig biogas plant • Blood from pigs added from 1. of September 2005 • Slow inhibition of biogas production observed in the beginning of October • Biogas production constituted only 40% of normal production at the 8. of november • Inhibition a combination of increasing pH and ammonia VFA concentration Biogas production
Related experiments Substrate characterization in batch Degradation more effective at 37oC than at 55oC Inhibition level at 37oC: between 0.5 and 1.0 g/l Inhibition level at 55oC: < 0.5 g/l
Related experiments Digestion at different temperatures in lab-scale reactors 55oC 37oC Threshold value for the Thermophilic reactor was 3.8 gN/l and 0.7-0.9 g free Ammonia-N/l. At mesophilic conditions it Was possible to work at an Ammonia concentration of 4.7 gN/l with a yield of 130 Ml methane/g VS Conclusions: Work at mesophilic temperatures or measure VFA frequently
Related experiments VFA surveillance of the plant
Related experiments Reactor experiment with lipids Day 60: 5% lipid (W/W) were added = 50% VS = no inhibition Day 87: 25% lipid (w/w) were added = 85 VS = inhibition Conclusion: plant added more lipid than allowed (25% TS)
What now? Ongoing experiments Recovery of the process following process imbalances
Recovery strategies • Stop feeding (the process recovers automatically). • Continued feeding with manure (addition of fresh substrate to keep up the biogas production) • Continued feeding with substrate adaptation will occur) • Re-inoculation with effluent (addition of new microorganisms) • Dilution with water (inhibiting compound is diluted)
1: Inoculum 3: LCFA or ammonia at steady biogas production Mixture Recovery of the biogas process Set-up 2: Manure
Recovery of the biogas process Long chain fatty acids inhibition Oleate addition
Recovery of the biogas process Long chain fatty acids inhibition Test of strategies 1180
Inhibition days Recovery of the biogas process Long chain fatty acids inhibition
0.5 g/l 1.0 g/l 0.5 g/l 1.0 g/l 2.0 g/l 2.0 g/l 2.0 g/l time (days) time (days) Pulses with oleate Effect of TS/VS
Recovery of the biogas process Long chain fatty acids inhibition • Conclusions: • Using one of the strategies could stimulate the recovery of the process • Following inhibition with LCFA, the recovery proceeded fastest when the biomass was diluted with manure. • The fast recovery with manure could be due to a higher concentration of TS/VS (fibers) However, what about reactor experiments!!!
Test of strategies Recovery of the biogas process Ammonia inhibition Prodution rates day 9 to 12 Control: + 50 ml Inhibition: + 26 ml
Recovery of the biogas process Ammonia inhibition
Recovery of the biogas process Ammonia inhibition • Conclusions: • The recovery of the biogas process following sn smmonis inhibition was strongly related to the ammonia concentration. • Addition of fresh manure gave the best recovery (lower ammonia concentration, fresh substrate) However, what about reactor experiments!!!
Acknowledgements Thanks to Sonia Guldener, Henar Meer de Soto and Elena Pueyo Abad for sharing their results. Thanks to Hector Garcia and Prasad L. Kaparaju for their technical assistance The work is supported by Energistyrelsens Energiforsknings-program (EFP-2005) Thank you for your attention!!!!