Download
1 / 27
280 likes | 475 Views
Implementing KPI Reporting in the College of LSA. Rob Wilke Nick Hadwick. Our Data Environment LSA in Context KPI Development Process System Demo How used Technical Infrastructure Challenges encountered Future Directions. BI: Data -> Information ->Knowledge -> Action.

E N D
Implementing KPI Reporting in the College of LSA Rob Wilke Nick Hadwick
Our Data Environment • LSA in Context • KPI Development Process • System Demo • How used • Technical Infrastructure • Challenges encountered • Future Directions
UM Data EnvironmentThousands of tables in PeopleSoftLarge datasetsPersonal data table – 2.3 million rowsAdmissions Program table – 2.3 million rows Student Enroll table – 6.7 million rowsJob table – 1.4 million rowsPay Check table – 8.5 million rowsDept table – 20,000 rows/3700 distinct DeptIDs
LSA:UMDistinct DeptIDs - 144:3700Student Enrollments – 3.8 million:6.7 million
College of LSA ~ 40 Academic Depts/Programs (3 Divisions – Humanities, Social Sciences, Natural Sciences) Museums Michigan Learning Communities Student Support: Advising, Language Resource Center, Science Learning Center, Study Abroad Dean’s Office 80% of Budget is Salary/Benefits
Heterogeneous Organization • What to measure? • Can you compare the Exhibit Museum with the English Department? • Why did we develop the KPI measures?
LSA KPI History • New Dean and Associate Deans • “Provost Indicators” • Student Headcount, Diversity • Faculty Appointments
Charge “Work within the realm of information we’re already producing to make information useful for planning at the Associate Dean and Executive Committee level that will show changes in the College over time and project to the future.”
Goals • Clear, Consistent and shared measures • Benchmarks to help think about resource distribution in the College • Not be reliant on self-reported data by departments
Principal Data Areas • Faculty/Staff – Counts and Characteristics • Graduate Student Characteristics • Funding • Space and Energy Utilization • Student Credit Hours • Degrees • Relationships between Inputs and Outputs
Development Process • Top down mandate from upper management • Modeled after Provost Indicators • Push detail down to departmental level • Team of Finance, Budget and IS personnel • 2 year trial period with departments • Incremental changes to add/subtract measures • Initial system was a Spreadsheet and PDF File
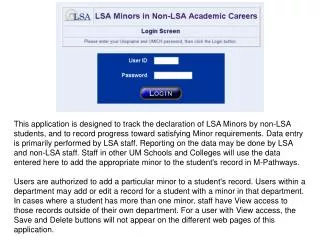
System Demonstration http://www-a1.lsa.umich.edu/AdminData/KPIDeptCompare.aspx
Decision Making • Student Credit Hours/TTFTE • Computed Course Releases/TTFTE • % Small Sections • % Over or Under Target Faculty lines (Resource Commitment) Position requests GSI, grader and fellowship funding Lecturer positions
Technical Environment • SQL Server 2000 database – 3 tables • IIS Web Server • ASP.Net 2.0 Development Environment • Originally Excel with Macros
Tables • Header • Key, Description, URL, DisplayOrder, Page, Classification (Profile, Indicator, Outline Separator) • Data • Key, DeptID, Year, Data value • Notes • Key, Title, Note content (Notes and Header tables include HTML stored with data)
Sample data 45,000+ rows
Challenges • Inconsistent Source Data • Lack of Understanding of Source Data • Source Data Not Reflecting “Reality” • Numeric Values only • Making Assumptions Transparent • Conflicting Indicators • Minimizing # of Indicators • Communicating Context to Depts
Future Direction • Create Charts on the fly • Drill down to see detail • “Top 10” lists of key values • Additional Research Indicator
Terminology Check • Key result indicators (KRIs) tell you how you have done in a perspective. • Performance indicators (PIs) tell you what to do. • KPIs tell you what to do to increase performance dramatically David Parmenter, Key Performance Indicators
Key Performance Indicators "KPIs represent a set of measures focusing on those aspects of organizational performance that are the most critical for the current and future success of the organization."
Key Result Indicators “KRIs typically cover a longer period of time than KPIs; they are reviewed on monthly/quarterly cycles, not on a daily/weekly basis as KPIs are.”
Ask the Right Questions “Rarely is the question asked, is our children learning?”