Download
1 / 8
120 likes | 406 Views
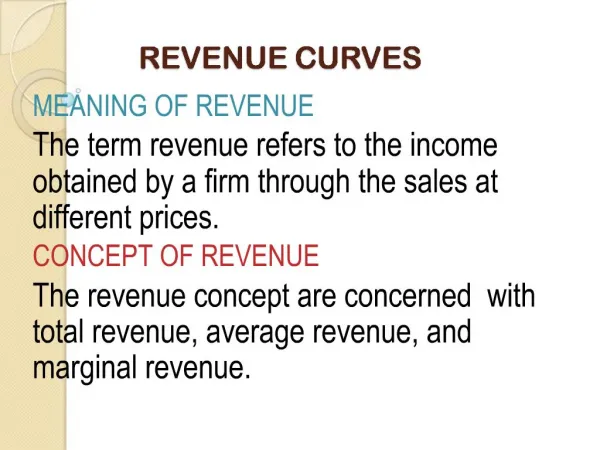
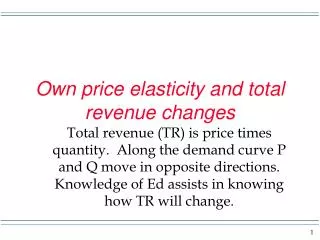
Elasticity & Total Revenue. Chapter 5 completion…. Total Revenue & Profit. Total revenue ( TR ) = Price X Quantity Sold The total amount of money received by a business selling products. It is NOT profit!. Coffee Shop: Price coffee : $2/cup

E N D
Elasticity & Total Revenue Chapter 5 completion….
Total Revenue & Profit • Total revenue (TR) = Price X Quantity Sold • The total amount of money received by a business selling products. • It is NOT profit! Coffee Shop: Price coffee: $2/cup Qty Sold: 500 per day Total Revenue = $2 X 500 = $1,000 Profit = TR – All Expenses (costs)
$4 Price × Quantity = $400 Price Demand ( total revenue) 100 Quantity Total Revenue Price Total Revenue changes as you move along the demand curve based on the elasticity of demand Quantity 0
All linear demand curves have bothelastic & inelastic ranges Points with high price & low quantity demand is elastic Points with low price & high quantity demand is inelastic Mid-point of line is unit elastic
Unit Elastic at midpoint of line Linear Demand Curve Elasticity Price $7 Elastic Range: Elasticity > 1 6 5 4 3 Inelastic Range:Elasticity < 1 2 % ∆ Qty D Ed = -------- . % ∆ P 1 14 12 0 6 8 10 2 4 Quantity
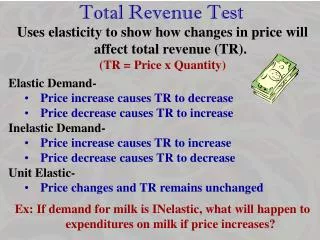
. . Total Revenue Total Revenue Price ↑ TR ↑ Price Increases & Total Revenue • Price ↑ => TR falls in elastic ranges • TR reaches maximum @ unit elastic • Price ↑ => TR rises in inelastic range Price ↑ TR ↓ . .
Elasticity Summary • Elastic demand curves are flat • Inelastic demand curves are steep • Slope is constant but elasticity is not! • Linear demand curves have both inelastic & elastic ranges • Total Revenue = Price X Quantity • Fallswhen Prices ↑ onelastic goods • Rises when Prices ↑ on inelastic goods • Firms maximizetotal revenue by producing at unit elasticity