Download
1 / 9
90 likes | 252 Views
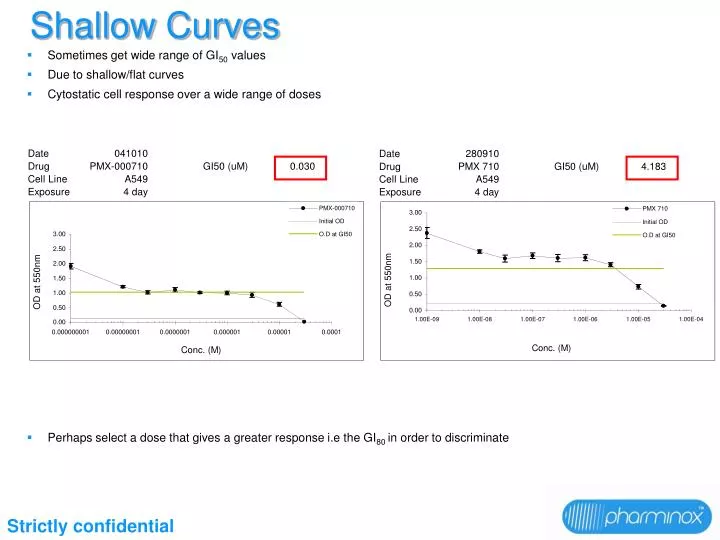
Sometimes get wide range of GI 50 values Due to shallow/flat curves Cytostatic cell response over a wide range of doses Perhaps select a dose that gives a greater response i.e the GI 80 in order to discriminate. Shallow Curves. Strictly confidential. TTA Confocal Study.

E N D
Sometimes get wide range of GI50 values • Due to shallow/flat curves • Cytostatic cell response over a wide range of doses • Perhaps select a dose that gives a greater response i.e the GI80 in order to discriminate Shallow Curves Strictly confidential
TTA Confocal Study Study carried out to find out whether poor activity of certain TTA analogues was due to compounds not getting into the cells. *COOH group in 3 position instead of the 2 position Conventional fluorescence microscopy gives images of light from the whole cell whereas confocal microscopy allows precise “sectioning” of cells through the vertical (Z) axis. Confocal allows us to check that the compound is inside the cell rather than the possibility of it only being on the outer surface/in the membrane Strictly confidential
TTA Confocal – Spectral properties - Absorbance 10mM stocks made in DMSO. Diluted to 500uM in DMSO. 100 ul to 96 well plate for asorbance scan. Strictly confidential
TTA Confocal – Spectral properties - Emission Same 500uM solutions in DMSO used. 50 ul to 384 well black plate for absorbance scan. Excitation at 488nm. Emmission recorded from 500 nm to 650 nm. Strictly confidential
TTA Confocal – RHPS4 Z-stack Following images taken focused on middle slice Strictly confidential
TTA Confocal – MCF7 Control PMX 170 PMX 646 PMX 670 RHPS4 Strictly confidential
TTA Confocal – HT29 Control PMX 170 PMX 646 PMX 670 RHPS4 Strictly confidential
TTA Confocal – HCT116 Control PMX 170 PMX 646 PMX 670 RHPS4 Strictly confidential
TTA Confocal – Results All compounds seen inside all cells. Compound in nucleus and cytoplasm but “holes” in some nucleii with all but PMX 170. Not counterstained so can’t be sure How does mountant work? Could there be diffusion of compound overnight? Brightness of images not apparently relative to excitation or emission maximums. Repeats planned to give more insight into sub-cellular location Nuclear counterstain Z-stacks Strictly confidential