1 / 0

Moving to Competitiveness: A Value Chain Approach

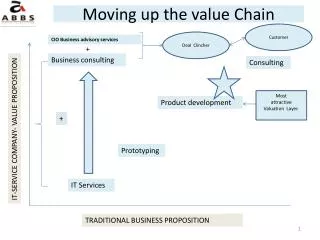
Moving to Competitiveness: A Value Chain Approach. Uma Subramanian. May 30, 2007 Berlin. IFC- The World Bank. Competitiveness = f (Input Costs, Trans. Costs, Productivity, Market access, e) Results expected: . Jobs created . Share of market . Investment generated.

hakan
Download Presentation

Moving to Competitiveness: A Value Chain Approach

An Image/Link below is provided (as is) to download presentation Download Policy: Content on the Website is provided to you AS IS for your information and personal use and may not be sold / licensed / shared on other websites without getting consent from its author. Content is provided to you AS IS for your information and personal use only. Download presentation by click this link. While downloading, if for some reason you are not able to download a presentation, the publisher may have deleted the file from their server. During download, if you can't get a presentation, the file might be deleted by the publisher.

E N D

Presentation Transcript


  1. Moving to Competitiveness:A Value Chain Approach Uma Subramanian May 30, 2007Berlin IFC- The World Bank
  2. Competitiveness = f (Input Costs, Trans. Costs, Productivity, Market access, e) Results expected: . Jobs created . Share of market . Investment generated Sound policies and institutions governing product and factor markets are critical for competitiveness Product market – trade policy, competition, price distortions, licensing, standards, property rights, logistics Factor market – wages, labor market rigidities, capital charges, utility price/quality, land market issues
  3. How does a Value Chain Analysis Help? The sectoral lens helps trigger a more comprehensive reform process Prioritization is key to being effective: Through benchmarking performance indicators with global competition and best practices, helps identify priorities Gets at priority issues specific to sectors as well as economy wide issues. Provides a concrete data based policy agenda for public and private sector in addition to the more traditional market related agenda.
  4. T-Shirt Value Chain: Kenya and Honduras Compared SOURCE MAKE DELIVER Outbound Logistics Overheads Raw Material Costs Labor Cost /T-Shirt FOB Cost Per T-Shirt Import Dependence Utilities Kenya ~ 65% $2.30 $0.40 $0.28 $3.60 $0.05 $0.57 Honduras ~ 80% $0.80 $0.16 $0.06 $1.30 $0.25 $0.03 High Tariffs: Honduras = 9.5% Kenya = 17.5% Impact of Rules of Origin Exacerbated by location and therefore transportation costs High Cost of Import Logistics Honduras = $ 670 / TEU Kenya = $2325 /TEU Total Import Logistics Time: Honduras = 39 days Kenya = 45 days Lower Wages Offset by Lower Labor Productivity Honduras: $12.00/ labor day Kenya: $9.40/ labor day Honduras: 45-50 shirts/day Kenya: 20-25 shirts/day Nominal Interest Rates Honduras: 18.8% Kenya: 12.9% Electricity Charges: Honduras: 3.5 cents/ kwh (IEA) Kenya: 6 cents/ kwh (IEA) Speed to Market: Honduras <15 days Kenya > 30 days High cost of Export Logistics: Honduras = $500/TEU Kenya = $1980/TEU High Incidence of Rejects: Honduras: <1% Kenya: >3%
  5. How does a Value Chain Analysis Help? The sectoral lens helps trigger a more comprehensive reform process Prioritization is key to being effective: Through benchmarking performance indicators with global competition and best practices, helps identify priorities Gets at priority issues specific to sectors as well as economy wide issues. Provides a concrete data based policy agenda for public and private sector in addition to the more traditional market related agenda.
  6. Public Sector Private Sector Reduce VAT Redemption delays Simplification of import/ export procedures Revise Investment Code to ensure level playing field between SME and large firms Improve land registries; clarify titling/ leasing or user rights Private power provision to rationalize cost and/or enhance performance Private water and sanitation Privatize air/ sea ports Economy Wide Remove tariff distortions on main imported inputs Reduce barriers to entry within sector that facilitate noncompetitive behavior Reduce barriers to Import Licenses Improve enforcement of product standards Policy for attracting FDI (e.g. hotels) Market Positioning Diversification of products and/or markets; Training to increase shop floor productivity Improve capacity of suppliers, TA to improve backward linkages Industry Specific Action Agenda
  7. Thank you!
  8. Example of Potential Implementation Projects following a Value Chain Project DOWNSTREAM PROJECTS BUSINESS ENABLING ENVIRONMENT/ FIAS WORLD BANK/ IFC Trade policy (tariffs, agreements) Infrastructure Labor policy Innovation Governance Land Policy Lending Investments Industry Specific Licensing Product Quality Standards Taxes Trade Logistics CSR (Labor or Env. Standards FDI Promotion Competition Policy Investment Law Land Admin. barriers Linkages Firm level/ bus. Assoc. Capacity Building IFC / Facilities
More Related