Download
1 / 22
220 likes | 317 Views
On the non-stiffness of edge transport in L-modes. O. Sauter, D. Kim, R. Behn, S. Coda, B. P. Duval, T. P. Goodman and the TCV team Ecole Polytechnique Fédérale de Lausanne (EPFL) Centre de Recherches en Physiques des Plasmas (CRPP) Lausanne, Switzerland. Motivation

E N D
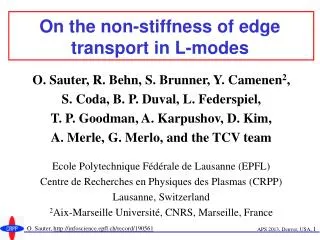
On the non-stiffness of edge transport in L-modes O. Sauter, D. Kim, R. Behn, S. Coda, B. P. Duval, T. P. Goodman and the TCV team Ecole Polytechnique Fédérale de Lausanne (EPFL) Centre de Recherches en Physiques des Plasmas (CRPP) Lausanne, Switzerland
Motivation Carbon profile shown independent of Ip on TCV Core scalelengths seem independent of Ip, despite tEIp Determine R/LTe vs Ip, PEC, d in core AND edge regions Core region is stiff, edge is not 1-D transport simulation with new model Conclusions Outline
Impurity transport independent of Ip O. Sauter et al, IAEA 2010 EXPC/P8-13 and EXS/P2-1
Same for Ti, vj independent of Ip Ti/Ti(0.8) O. Sauter et al, IAEA 2010 EXPC/P8-13 and EXS/P2-1
electron transport independent of Ip as well We Ip Profiles self-similar outside mixing radius Ip scan: q95 from 2.5 to 10
What is R/LTe global profile for gyrokinetic? B R/LTe~cst A • A: R/LTe0 at r=1 : Used in most simulations • B: R/LTe 3-10*(core) at r=1 : seems proposed by expt
ne, Te versus Ip in TCV, with z-axis sweep Thomson data, with slow z-axis sweep Clear increase of total energy with Ip
log(pe) R/Lpe identical in core R/Lpe Ip for rV>0.8 (x2.6>core at Ip=285kA) Change of scalelengths only for rV>0.85 pe/pe(0.98) pe/pe(0.8) • Normalization vs value at r=0.8 is not a good idea • Normalizing at r=0.98 depends on the quality of fit Note: ry too narrow edge region
PEC scan at constant Ip • Normalization on pe(0.8) shows self-similar profiles
PEC scan at constant Ip Stiff in core non-stiff in edge
PEC scan at constant Ip • Stiff in "core" region R/LTe15 • R/LTe >30-40 in edge region
Strong effect of d on global profiles • d<0: same prof with ½ PEC Y. Camenen et al, Nucl. Fusion 47 (2007) 510
Strong effect of d on global profiles • d<0: same prof with ½ PEC • d<0: higher pe with same PEC
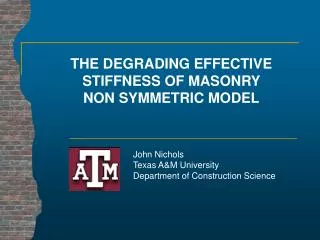
1½-D transport simulations with ASTRA "Local" transport characteristics in stationary state: Stiff: ce increases when Qe increases => R/LTecst
Qe/Te versus R/LTe from TCV data R/LTecst R/LTe R/LTe Ce(edge) is large but it is relation between Qe_norm and R/LTe which matters
Leads to strong diff. with P↑ 30.8 20.8 stiff non-stiff 30.1 A combined core-stiff / edge-non-stiff model Assuming edge non-stiff: test on P scan (3) (1) 1200 800 400 • Three main regions w.r.t transport: • center: ST/current hole effects: large c • Core: stiff, R/LTe~cst • Edge: non-stiff Stiffness: tE P-0.7 (2)
Results using 1-D ASTRA model • We start from this ce profile and other plasma parameters • Scale core ce~P0.7 and edge with P0.1
Same technique for d=+0.4, d=-0.4 cases 16 P0.1 Stiff edge not sufficient 11 P0.1 2.3 P0.8 2.3 P0.8 • Recover profiles with: • Same transport in core: P-0.7 • Reduced transport near edge with d<0
Reconciles with gyrokinetic simulations A. Marinoni et al, PPCF Plasma 51 (2009) 055016 • Difference in linear and nonlinear simulations found only for r>0.7 • Present model resolves this issue GAMs, see TCV comprehensive analysis S. Coda TTF2013
Conclusions • Core transport limits R/LTe (and R/Lne to some extent) • Even with favourable Ip scaling profiles remain self-similar • Therefore values at r=0.8 are changing with Ip • This is possible with non-stiff transport in [0.8,1]: • c hardly increase with increased power • Simple model recovers Ip, P scsaling and d effects with: • c ~ P0.7-0.8 in core • c ~ P0-0.2 in edge • Explains effects of negative d (which does not penetrate) • Explains good P scaling of edge I-mode • Explains profile consistency • Explains "I-family", + can have wide variety of parameters • Shows how L-mode builds up R/LTe100 with increasing power towards H-mode transition