Download
1 / 26
260 likes | 414 Views
ENSO SIGNATURE IN NORTH EUROPEAN TIME SERIES OF ICE CONDITIONS DETECTED BY SINGULAR SPECTRUM ANALYSIS AND WAVELET TRANSFORM. Aslak Grinsted, Thule institute, Oulu University, Finland Svetlana Jevrejeva , Proudman Oceanographic Laboratory, UK

E N D
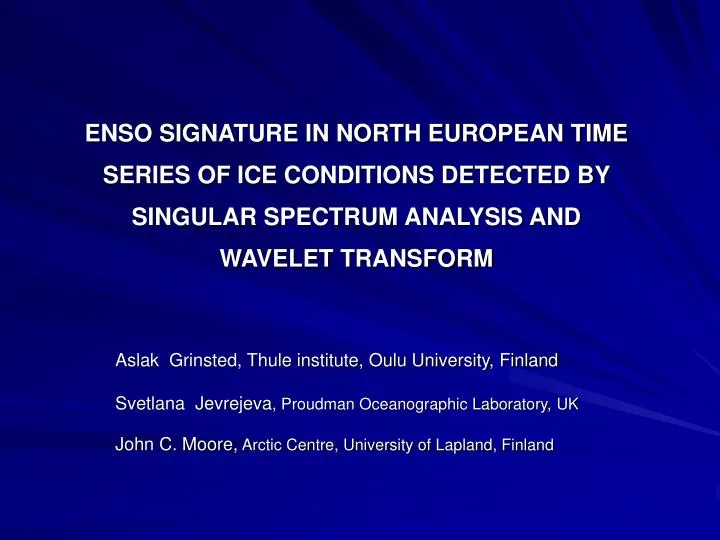
ENSO SIGNATURE IN NORTH EUROPEAN TIME SERIES OF ICE CONDITIONS DETECTED BY SINGULAR SPECTRUM ANALYSIS AND WAVELET TRANSFORM Aslak Grinsted, Thule institute, Oulu University, Finland Svetlana Jevrejeva, Proudman Oceanographic Laboratory, UK John C. Moore,Arctic Centre, University of Lapland, Finland
Motivation • In a previous study we analyzed the relationship between the NAO/AO and ice conditions in the Baltic Sea; some of the detected oscillations were associated with ENSO signals (2.2-2.8, 3.5, 5.2-5.7, 13-14) [ Jevrejeva and Moore, 2001]
Influence from AO on ice conditions AO warm phase • Warmer and wetter in northern Europe • below normal Arctic SLP • enhanced surface westerlies in the north Atlantic AO cool phase • Colder & drier N.Europe • Relatively high Arctic SLP • Weakened surface westerlies in the North Atlantic Kay Dewar, John M. Wallace, David W. J. Thompson davet@atmos.colostate.edu
Motivation • In a previous study we analysed the relationship between the NAO/AO and ice conditions in the Baltic Sea; some of the detected oscillations were associated with ENSO signals (2.2-2.8, 3.5, 5.2-5.7, 13-14) [Jevrejeva and Moore, 2001] • Several studies indicate that the impacts of ENSO are more readily seen in the north Atlantic sector during winter than summer, that there is a roughly 3-month lag between tropical signal and extra-tropical response, and that signal to noise ratio is rather low [Trenberth, 1997; Pozo-Vázquez et al., 2001; Cassou and Terray, 2001]. • These considerations motivate our approach in developing novel wavelet approaches and applying them to simultaneously extract both the signals in noisy datasets, and the phase angle between tropical and North Atlantic/Arctic signals. • In this study we describe the connections between time series analysis and nonlinear dynamics, discuss signal- to –noise enhancement, we discuss signals with relatively low contribution to total variance, however, detected signals are statistically significant (70% noise)
Objective Barents 2002 • The main objective of our study is to compare statistically significant components from ENSO represented by SOI (and Niño3) and ice conditions in the Barents and Baltic seas.
Data sets Data sets treated here: • SOIautumn index (1856-2000) (Ropelewski and Jones, 1987); • AO winter index (1851-1997) (Thompson and Wallace, 1998); • BMI: Maximum annual ice extent on the Baltic Sea (1720-2000) (Seinä et al, 2001); • BarentsE: April ice extent in the (10E-70E) Barents Sea for the period 1864-1998 [Vinje, 2001]. • GreenlandSea: April ice extent in the Greenland Sea (30W-10E) for the period 1864-1998 [Vinje, 2001]. Note that SOI and Niño3 data sets are delayed by 3 months relative to arctic indices. Other data sets analyzed but not presented in detail: Time series of date of ice break-up in Riga (1708-1990) (Jevrejeva, 2001); Time series of date of ice break-up in Helsinki (1829-1984) (Leppäranta and Seinä, 1986); Winter air temperature in Uppsala (1722-1997) (Moberg et al, 1999); Niño3 SST index during autumn (1857- 2001) (KNMI);
Data sets Nino3 SOI AO BMI BarentsE Greenland Sea
Application of MC-SSA(Monte Carlo Singular Spectrum Analysis (Allen and Smith, 1996)) • to determine non-linear trends and quasi-periodic components (signals) in time series of SOI /Niño3 and ice conditions time series • to estimate a significance of the signals by comparing results to noise models (only signals with 95% of significance level are considered) • to calculate a contribution from a particular signal to the total variance • to identify and compare significant signals • to show the evolution of those signals over time
SSA non-linear trend oscillations Time series of maximum ice extent in the Baltic Sea (BMI) noise
Oscillations Oscillations in time series, [ ] rows indicate the rank of the EOFs, bold figures show oscillations significant at the 95% against AR(1) red-noise, others are significant at the 95% level against white noise SKIP?
vinij12 vinij12 1 0.5 0 Normalized 3.5 yrs signal from SOI (red) and from time series of maximum ice extent in the Barents Sea (black) -0.5 -1 -1.5 1850 1900 1950 2000
jriga 1 0.5 0 Normalized 5.7 yrs oscillations from time series of date of ice break-up at Riga (Baltic Sea, red) and Niño3 (blue) -0.5 -1 -1.5 1700 1750 1800 1850 1900 1950 2000
Results from MC-SSA • Similar signals, with periods of about 2.2- 2.8, 3.5, 5.7, and 12.8 years, are detected in time series of SOI/Niño3 and ice conditions by application of MC-SSA. • Signals 2.2- 2.8, 3.5, 5.2-5.7 , and 12.8 years periodicities are isolated and analysed. • However the variation over time of amplitude and relative phases of the quasi-periodic signals seen in the times series has not been investigated in any detail, though this is clearly needed to aid identification of forcing mechanisms.
Wavelet transforms Wavelet transform (WT) - is a tool for analyzing localized variations of power within a time series. By application of WT we decompose the time series into time-frequency space, in order to determine both the dominant modes of variability and how those modes vary in time. The wavelet power spectrum. Contours are normalized variance, thick black line is the 5 % significance level using the red noise model, solid line indicates the cone of influence. Torrence and Compo, A practical guide to wavelets, Bull. Amer. Meteor. Soc, 79, 61-78, 1997.
Wavelet transform for two time series • Continuous wavelet (amplitude and phase, Morlet (1985)) • Wavelet power spectrum (a measure of the time series variance at each scale (period) and at each time) • Crosswavelet power spectrum • Wavelet Coherence is used to identify frequency bands within which two time series are covarying.
AO and ice conditions BMI strong link to AO BarentsE in 12-16 year band GreenlandSea: almost no significant coherence with AO. (A common ’event’ at ~1968) Ice out of phase with AO AO/GreenlandSea AO/BarentsE
Why does AO have stronger link to Baltic than the Barents? • The Baltic is a closed system that is reset every year. The Barents Sea is subject to rotation of ice in the Arctic and has a longer internal memory. AR1 coefs:
1 0.5 0 -0.5 -1 -1.5 1850 1900 1950 2000 Date The AO exhibits a significant power peak in the 3.5-5.7 year band between 1935-1950, which is also associated with a period of higher power at 3.5-5.7 years in SOI Crosswavelet power and coherence indicate large covariance between SOI/AO indices at scales of 3.5-5.7 years. Furthermore, the coherence phase is 358º ± 8º, showing that SOI and AO signals are in phase. (note: SOI autumn while AO winter) High power and coherence in the AO associated with signals on the 12-16 year timescales since 1940 is linked to the SOI Wavelet coherency and phase between SOI and AO; contours are wavelet squared coherencies, vectors indicate the phase difference between the SOI/AO, mean angle is 358º ± 8º SSA normalized components of the 13.9 year oscillation in winter AO (red) and the 13.5 year oscillation in autumn SOI (blue); results are significant at the 95% level against a white noise model
SOI and the Baltic Phase angle is 2º ± 8º Phase angle is 200º ± 6º The ENSO signatures found in AO are also present in the BMI. This confirms the MC-SSA results.
Baltic severe ice winters and SOI The most severe ice conditions in the Baltic Sea observed over the past 150 years were probably in 1939-40, 1941-42, and 1946-47 [Seinä et al., 2001], all are associated with high power in the AO & SOI 3.5-7.8 year band. The winters of 1887-88, 1888-89 are also in the list of most severe winters [Seinä et al., 2001].
SOI and BarentsE The 12-20 year ENSO signature found in the AO is also present in the BarentsE. Note: Confirms our results from MC-SSA.
MC-SSA focus on the 13-14 year periodicity Note: Phase locked and similar trends in amplitude. Roots in same physical system? Phasings? The significance of the EOF pairs involved in the reconstructions has been tested against red-noise and we find that the AO pair is significant at the 98% level, SOI at 83%, BMI at 91% and BarentsE at 62%.
Conclusions • Significant ENSO signatures found in AO, BMI and to some degree BarentsE. (2.2- 2.8, 3.5, 5.2-5.7, and 13 years) (Wavelets & MC-SSA) • Severe ice conditions in the Baltic Sea linked to AO via signals of 2.2-7.8 year periodicity. Which in turn are linked to warm events in the tropical Pacific Ocean where similar signals are seen ~3 months earlier. • There’s a common 13-14 year period in AO, SOI, BMI and BarentsE. SOI seems to lead AO by ~2 years. What is the physical mechanism?
Acknowledgements • Financial assistance was provided by the Thule Institute and the Academy of Finland. Some of our software includes code originally written by C. Torrence and G. Compo that is available at: http://paos.colorado.edu/research/wavelets/ and by E. Breitenberger of the University of Alaska which were adapted from the freeware SSA-MTM Toolkit: http://www.atmos.ucla.edu/tcd/ssa. Aslak Grinsted, ag@glaciology.net
A 3 month ENSO-Arctic link? • The mechanism of QBO signal propagation is described by Baldwin et al. [2001]: the QBO modulates extra-tropical wave propagation, affecting breakdown of the wintertime stratospheric polar vortices. The polar vortex in the stratosphere affects surface weather patterns providing a mechanism for the QBO to have an effect on high latitude weather patterns, and hence winter ice severity.
Selected references Allen, M.R., and L. A. Smith, Monte Carlo SSA, detecting irregular oscillations in the presence of coloured noise, J. Clim., 9, 3383-3404, 1996. Baldwin, M.P., L.J Gray, T.J Dunkerton, K. Hamilton, P.H. Haynes, W.J. Randel, J.R. Holton, M.J. Alexander, I. Hirota, T. Horinouchi, D.B.A Jones, J.S. Kinnerslay, C. Marquardt, K. Sato, and M. Tarahashi, The Quasi-Biennial Oscillation, Reviews of Geophysics, 39, 170-229, 2001. Ghil, M., M. R. Allen, M. D. Dettinger, K. Ide, D. Kondrashov, M. E. Mann, A. W. Robertson, A. Saunders, Y. Tian, F. Varadi, and P. Yiou, Advanced spectral methods for climatic time series, Rev. Geophys., 40(1), 1003, doi:10.1029/2000RG000092, 2002. Jevrejeva, S., and J.C. Moore, Singular Spectrum Analysis of Baltic Sea ice conditions and large-scale atmospheric patterns since 1708, Geophys. Res. Lett., 28, 4503-07, 2001. Jevrejeva, S., Severity of winter seasons in the northern Baltic Sea during 1529-1990: reconstruction and analysis, Clim. Res., 17, 55-62, 2001. Jevrejeva, S., Association between the ice conditions in the Baltic Sea and the North Atlantic Oscillation, Nordic Hydrol., 33,319-330, 2002. Jevrejeva, S., J. Moore, A. Grinsted. Influence of the Arctic Oscillation and ENSO on Ice Conditions in the Baltic Sea: the Wavelet Approach. J. Geophys. Res., Atm, 10.1029/2003JD003417, 2003 Moritz, R.E., C.M. Bitz, and E.J. Steig, Dynamics of Recent Climate Change in the Arctic, Science, 297, 1497-1502, 2002. Seinä, A., H. Grönvall, S. Kalliosaari, and J. Vainio, Ice seasons 1996-2000 in Finnish sea areas / Jäätalvet 1996-2000 Suomen merialueilla, Meri, Report Series of the Finnish Institute of Marine Research, 43, 2001. Torrence, C., and G.P. Compo, A practical guide to wavelet analysis, Bull. Am. Meteorol. Soc., 79, 61-78, 1998. Vinje T., Barents Sea ice edge variation over the past 400 years, Extended abstract, Workshop on Sea-Ice Charts of the Arctic, Seattle, WA, World Meteorological Organization,WMO/TD No. 949, 4-6, 1999. Vinje, T., Anomalies and trends of sea ice extent and atmospheric circulation in the Nordic Seas during the period 1864-1998, J. Clim., 14, 255-267, 2001. ……