Download
1 / 30
300 likes | 410 Views
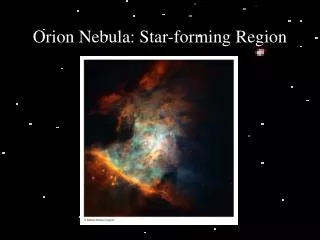
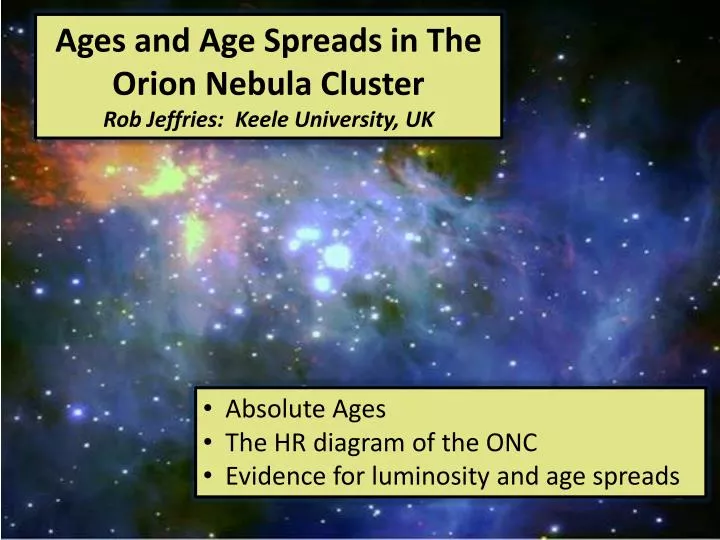
Ages and Age Spreads in The Orion Nebula Cluster Rob Jeffries: Keele University, UK. Absolute Ages The HR diagram of the ONC Evidence for luminosity and age spreads. Absolute Age Constraints. 3 Myr. 5 Myr. UMS evolution 2.8 - 5.2 Myr (68%) Naylor 2009, MNRAS, 399, 432

E N D
Ages and Age Spreads in The Orion Nebula Cluster Rob Jeffries: Keele University, UK • Absolute Ages • The HR diagram of the ONC • Evidence for luminosity and age spreads
Absolute Age Constraints 3 Myr 5 Myr UMS evolution2.8 - 5.2 Myr (68%) Naylor 2009, MNRAS, 399, 432 Low-mass isochrones1 – 3 Myr Model dependent – precise, but inaccurate Hillenbrand 1997, AJ, 113, 1733; Da Rio et al. 2010, ApJ, 722, 1092 Proplyd lifetimes<1.5 Myr e.g. Clarke 2007, 376, 1350 Ejected runaways >2.5 Myr Hoogerwerf et al. 2001, A&A, 365, 49 But may not come from the ONC!
PM-selected 1 Myr 3 10 Siess isochrones ONC: Da Rio et al. 2010, ApJ, 722, 1092 ONC JHK Subaru
Mean = 6.42 σ = 0.43 dex 90% between 0.5 and 15 Myr 5% 95% Are these spreads in luminosity real? If so, do they imply large age spreads? ONC JHK Subaru
Estimated uncertainties FromReggiani et al. 2011 (log age)=0.43 ONC PM members ONC observed age spread t L-3/2 so (log t)=0.15-0.2 dex (log age)=0.43 dex (log t)< (log age) -Uncertainties cannot explain spread (unless they have been badly underestimated) Reggiani et al. 2011, A&A, 534, A83
Estimated uncertainties FromReggiani et al. 2011 (log age)=0.43 ONC PM members ONC observed age spread t L-3/2 so (log t)=0.15-0.2 dex (log age)=0.43 dex (log t)< (log age) -Uncertainties cannot explain spread (unless they have been badly underestimated) Reggiani et al. 2011, A&A, 534, A83
Extinction Problems? Move to the near-IR Same result – but perhaps some “old” objects are obscured by edge-on disks? Slesnick et al. 2004, ApJ, 610, 1045
“Old” stars, edge on disks? A few… 1 Myr [3.6]-[8.0]>0.7 10 Myr ONC: Megeath et al. 2011 See Manara et al. 2013, arXiv: 1307.8118
Sample is biased against “oldest” objects Find a sample with rotation period Pandv sini R sini/R = 0.02 (P/days) (v sini/km/s) Jeffries, 2007, MNRAS 381, 1169 ONC JHK Subaru
Excellent age discrimination at < 10 Myr ONC JHK Subaru
ONC: Jeffries 2007, MNRAS, 381, 1169 dex Spread in R of 2-3 FWHM: agrees with L spread ONC JHK Subaru
ONC Results • Distribution of Rsin(i) is consistent with luminosity profile from H-R diagram for these stars. • Radius at a given Teff varies by factors of 2-3 • If interpreted as an age spread then the ONC is not coeval and the extent of age spreads broadly agrees with the HR diagram.
Are the luminosity spreads real…? Assessment of confounding uncertainties suggests so. Spread in stellar radii suggests so. Possible issues with some very low luminosity objects perhaps viewed in scattered light So overall…. Yes! But does this imply an age spread? We need independent clocks
Younger, larger, disks, slow Older, smaller, No disks, fast Rotation and disks as clocks Cieza et al (2007) Da Rio et al (2010) Period (d) Young, (luminous) stars should rotate more slowly
Problem: Stars appear to spin down as they contract! Luminous/”Young”(?)Faint/”Old”(?) ONC N2264 N2362 Cep OB3b Divide stars into “young” (luminous) and “old” (faint) subsets. Littlefair et al. 2011, MNRAS, 413, L56 Period (days)
1 Myr 10 Myr Stars with periods in Herbst et al. 2002, A&A, 396 ,513
Hernandez et al. 2008, ApJ, 686, 1195 Based onSpitzer data Disc presence as an independent clock?
Disc presence as an independent clock Increasing REAL age spread within a cluster should bring differences in the age distributions of stars with and without discs e.g. Toy Model with Increasing real age spread σ= 0.0 dex σ= 0.2 dex σ= 0.4 dex discs no discs Observed Log (Age/yr) Jeffries et al. 2011, MNRAS, 418, 1948
ONC [3.6]-[8.0] Mean Log Age (yr) (Log Age) Discs 6.36 0.42 No Discs 6.33 0.39 Null KS-Test p=0.51 Problem: Stars with and without discs have similar ages! 1 Myr [3.6]-[8.0]>0.7 10 Myr ONC: Megeath et al. 2011 Jeffries et al. 2011, MNRAS, 418, 1948
Hernandez et al. 2008, ApJ, 686, 1195 The Mean disk frequency, is as expected for a mean age of 2-3Myr… But why is it not age dependent? Constant disk frequency with age?
Disk lifetime Age spread σ< 0.15 dex Real age spread (dex) Observed Age Real Age Spread (dex) Model: Assume Gaussian dispersion in log Age and exponential disk decay Match: Disk fraction and “age” distributions of stars with and without disks Any age spread is limited to 0.14 dex at 99% confidence Disc lifetime is (6 1) Myr, constrained by mean age and fraction of stars with discs Conclusion: Real age spread < Median disk lifetime Jeffries et al. 2011, MNRAS, 418, 1948
Mean Log Age (Myr) (Log Age) Discs 6.35 0.45 No Discs 6.24 0.44 Could this be affected by ONC foreground contamination? No. Only stars with Av >1 [3.6]-[8.0]>0.7 Null KS-Test p=0.78
A possible solution – Early “Cold” Accretion? Baraffe et al. 2009, ApJ, 702, L27; 2012, ApJ, 756, 118 Class I stars accreting at 10-4 M/yr in short bursts. At 1 Myr, stars have much smaller radii and lower L than non-accreting model of same final mass. Hence APPEAR older than 10 Myr! (and may also have depleted Li) Position of stars at 1 Myr after episodic accretion 10Myr
Lithium depletion in PMS stars Li gone in 10 Myr! 7Li + p 4He + 4He at 2.5x10⁶ K Halted by growing radiative core 6Li destroyed at lower temperatures ONC JHK Subaru
PM-selected 3 1 10 Siess isochrones Li depleted objects? Palla et al. 2007, ApJ, 659, L41
Little sign of strong Li depletion or correlation with “age” (veiling-corrected) Model isochrones Palla objects Sergison et al. 2013, MNRAS, 434, 966
Appears to rule out cold accretion as a major source of HRD scatter? ONC Expected Li depletion Limit on observed depletion Only models 4-8 result in big shifts in the HRD Sergison et al. 2013, MNRAS, 434, 966
Conclusions • Absolute ages uncertain by factors of 2 • Luminosity and Radius spreads in young clusters are likely REAL. • However, they probably DON’Timply real age spreads of 10 Myr. • HR diagram uncertainties are hugely underestimated or something scrambles the HR diagram. • Either way, SFR histories and PMS ages (<10 Myr) seem UNRELIABLE.