Download
1 / 62
670 likes | 1.95k Views
Internal Respiration. Module F. Module F. Chapter 9 – Assessment of Hypoxemia and Shunting Chapter 10 – Treatment of Hypoxemia and Shunting Chapter 11 – Hypoxia: Assessment and Intervention. Objectives. At the conclusion of this session the participant will:

E N D
Internal Respiration Module F
Module F • Chapter 9 – Assessment of Hypoxemia and Shunting • Chapter 10 – Treatment of Hypoxemia and Shunting • Chapter 11 – Hypoxia: Assessment and Intervention
Objectives At the conclusion of this session the participant will: • Still be awake! This covers 3 chapters! • Relax…most is a review and some will be covered in Winter 09. • Define oxygen extraction. • Describe the effects of anaerobic metabolism. • State the formula for calculating RQ. • List the 5 causes of hypoxemia. • State the effect of an increase or decrease in cardiac output on the shunt fraction. • List three methods, other than the shunt fraction, which can be used to assess the degree of physiologic shunting. • State three ways to treat acute hypoxemia.
Objectives • Define anemia. • List three types of anemia and state the causes of the defect. • Describe the effect of anemia on the presence of hypoxia. • State the benefit, problems, and specific levels for each of the following as it relates to it being an indicator of cellular hypoxia: • Lactate • Mixed Venous Oxygenation • Oxygen Consumption & Utilization • Gastric Mucosal Acidosis
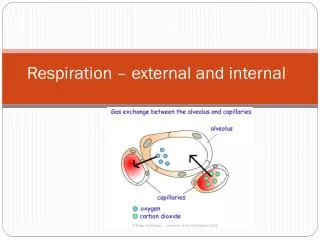
Internal Respiration • Exchange of oxygen and carbon dioxide at the cellular level. • Some control by local vasculature. • Increased distance from capillary to tissue will result in decreased delivery. • Some organs use more than others. • Table 7-1 (p. 188). • Note: % of blood flow is not equal to volume of oxygen consumed.
Internal Respiration • Normal metabolism exists when O2 is consumed and CO2 is produced. • Normal ratio of CO2 produced : O2 consumed is 0.8:1 (200/250) • Increased ratio with excess CHO utilization; decreased with fat & ETOH. • When insufficient oxygen is present, anaerobic metabolism results. • Less ATP produced. • Lactic Acid is produced.
Adequacy and Efficiency of Oxygen Delivery • Adequacy: Is there sufficient oxygen present? (Hint: Is hypoxemia present?) • Causes of Hypoxemia • Low PIO2 • Hypoventilation • Absolute Shunts • Relative Shunts • Diffusion Defects • True or Absolute Deadspace (secondary mechanism) • Efficiency: Is the PaO2 appropriate for the FIO2? • If not…assume a shunt is present!
Effects of Cardiac Output on PaO2 • The normal decrease in PaO2 from alveolar oxygen levels is due to the small mixing of anatomically shunted blood (5%). • This blood is venous in nature and has a PO2 the same as the PO2. • Four situations exist that can affect the PaO2: • Decreased Cardiac Output with a Normal Shunt • Increased Shunting with a Normal Cardiac Output • Decreased Cardiac Output with an Increased Shunt • Increased Cardiac Output with an Increased Shunt
The Normal Ventilation/Perfusion Relationship • Normal PAO2 • Normal PćO2 • Normal PO2 • Normal CO • Normal Oxygen Consumption • Normal PaO2
Decreased Cardiac Output with a Normal Shunt • PO2 decreases with a decrease in cardiac output because of an increased oxygen extraction (assumingO2 doesn’t change). • Any shunted blood will have a reduced PO2. • Because the amount of shunted blood is so small, the decrease in PaO2 isn’t significant.
Increased Shunting with a Normal Cardiac Output • Example: ARDS • Normal Cardiac Output = Normal PO2 • The problem here is a significant increase in intrapulmonary shunt, meaning more PO2 “contaminated” blood entering the pulmonary vein (arterial system).
Decreased Cardiac Output with an Increased Shunt • Similar to the first scenario, but here there is an increased intrapulmonary shunt. • Example: ARDS with an MI • Reduced Cardiac Output yields a reduced PO2 (higher extraction). • More of that low PO2 blood is shunted in the lungs, resulting in a large reduction in PaO2.
Increased Cardiac Output with an Increased Shunt • Normal physiologic response to hypoxemia is to increase heart rate (peripheral chemoreceptors) and Cardiac Output. • PO2 is increased (better oxygen delivery). • With an increased intrapulmonary shunt, however, there still is an increased amount of PO2 “contaminated” blood entering the system.
So What? • Don’t always assume that an improvement or deterioration in PaO2 is occurring solely because of a change in pulmonary gas exchange. • Suspect a change in cardiac output when an abrupt, unexplained hypoxemia is observed in critically ill patients. • Also, consider other non-cardiac causes of reduced PO2. • Anemia • Increased metabolism (fever) • Maldistribution of systemic perfusion
Assessment of Hypoxemia • Definition of “Hypoxemia”. • Severity? • Causes of Hypoxemia • Differential Diagnosis of Hypoxemia
Shunt Substitutes • P(A-a)O2 • PaO2/PAO2 • PaO2/FIO2
PAO2 • PAO2 = [(PBARO - PH2O) x FIO2] – (PaCO2/0.8) • On FIO2 of less than 60% • PAO2 = [(PBARO - PH2O) x FIO2] – PaCO2 • On FIO2 greater than 60% • Normal Values: • Room Air: 100 – 104 mm Hg • 100% Oxygen: 600
P(A-a)O2 • Normal values is around 10 mm Hg on room air. • Values increase with increasing age and the supine position. • Normal values 25-65 mm Hg on 100% • Difficult to use when FIO2 varies from 21 or 100% • Normal values differ for each FIO2 • Limited value when using supplemental oxygen.
P(A-a)O2 on Room Air • Normal A-a gradient on 21% is seen with: • Pure hypoventilation • High altitude • Diffusion defect (patient at rest) • Abnormal A-a gradient on 21% is seen with • Relative shunt • Absolute shunt
P(A-a)O2 on 100% • Relative Shunt will improve • A-a gradient less than 300 mm Hg • Absolute Shunt will not improve • A-a gradient is greater than 300 mm Hg
Using P(A-a)O2 to Estimate Shunt • On 100% FIO2, a 1% shunt is estimated for every 10 – 15 mm Hg P(A-a)O2 • Example: A-a gradient is 140 mm Hg • 140 = 9.3% 140 = 14.0% 15 10
Using P(A-a)O2 to Estimate Shunt • Normal Shunt is 5% • Add 5 % to the normal 5% shunt for every 100 mm Hg gradient; Example: • 100 mm Hg – 10% • 200 mm Hg – 15% • 300 mm Hg – 20%
Shunt Equation • Classic Shunt Equation • “Gold Standard” • Clinical Shunt Equation • A shunt greater than or = 15% is significant • Increased shunts will correlate with • “White out on x-ray unless its cardiac in origin. • Atelectasis, pneumonia, pulmonary edema, ARDS
Classic Shunt Equation • Where: • CćO2= (1.34 x Hb x 1.0) + (PAO2 x .003) • Assumes 100% saturation in the ideal alveolus • Requires a Pulmonary Arterial Catheter (BTFDC)
Clinical Shunt Equation • Requires a Pulmonary Arterial Catheter (BTFDC) • Only accurate at lower FIO2
PaO2 /PAO2 (a-A ratio) • Normal value is greater than 75% on any FIO2 • Example: 100/104 = 96% • 96% of oxygen is diffusing across the A-C membrane
PaO2/FIO2 ratio • Normal value is 400 – 500 • Example: 100 mm Hg/.21 = 476 • Value between 200 – 300 = ALI • Value less than 200 = ARDS • Values less than 200 correlate with a shunt of greater than 20%
Treatment of Hypoxemia • Increase FIO2 • Increase MAP • PEEP,Inspiratory Time, Vt • Body Positioning • Prone Positioning • Lateral decubitus (good lung down) • Good bronchial hygiene • Suction, bronchodilators, CPT/Flutter/PEP
Oxygen Administration • Treat hypoxemia/Hypoxia • Decrease the work of breathing • Decrease the work of the heart
Hazards of Oxygen Therapy • Absorption atelectasis • Oxygen Toxicity • Retinopathy of prematurity • Oxygen induced hypoventilation in COPD • Look for oxygen levels above 60 mm Hg and a rising PaCO2 • Evaluate FIO2 patient is receiving • Patient symptomatic: sleepy, lethargic
Hyperoxemia • PaO2 greater than 100 mm Hg • Usually undesirable • Very little oxygen content is gained • A PaO2 above 130 mm Hg indicates the patient is breathing supplemental oxygen. • Hyperoxemia is indicated in COHb%.
Hyperoxemia • SpO2% of 100% means the PaO2 could be between 100 mm Hg & 600 mm Hg • Very dangerous in infants
Oxygen Administration in Chronic Hypercapnia • PaO2 will increase 3 mm Hg for each 1% increase in FIO2 • Keep PaO2 around 60 mm Hg • FIO2 = 60 - PaO2 on room air 3
Example • You are asked to draw an ABG on a CO2 retainer. The PaO2 is 39 mmHg on 21% Where should the FIO2 be set? FiO2 = 60 - 39 = 7% Add to 21% 3 • Set FIO2 at 28%
Calculating the maximal PaO2 for any given FIO2 • The PaO2 on room air during hyperventilation may go up to 130 mm Hg • A PaO2 more than 5 times the % of oxygen is suspicious. • 30 x 5 = 150 • 40 x 5 = 200 • 50 x 5 = 250 • 60 x 5 = 300
Problem • pH 7.32, PaCO2 48, PaO2 200, FIO2 .30 • PAO2 = 760 – 47 x 0.30 – 48/.8 = 154 mm Hg • Can’t have a PaO2 greater than PAO2, so… • Either the FIO2 was not recorded accurately • Lab error (air bubble)
Evaluating FIO2 • High flow devices may not be delivering the FIO2 that is set • If the patient’s total flowrate is exceeding the flow from the oxygen delivery device, the FIO2 will decrease • Water in the aerosol tubing will increase FIO2 • High flow oxygen delivery systems should be analyzed
Analyze High Flow Systems • Polarographic (battery and electrolyte solution) • Galvanic (fuel cell) • Troubleshooting: If analyzer is not reading the FIO2 within + 2% then: • Calibrate analyzer first • Change fuel cell (galvanic) or • Change battery/electrolyte level (polarographic)
Correlating ABG to the Patients Condition • A patient who looks good but has bad ABG • Suspect a lab error • Venous blood gas sample • COPD (high PaCO2 and HCO3-)
Correlating ABG to the Patients Condition • A patient who looks and feels bad but ABG are good. • CO poisoning, MetHB% • Tissue hypoxia • Anemic hypoxia • Histotoxic hypoxia • Circulatory hypoxia • Pulmonary embolism – high Vd/Vt ratio and highE
Analyzing an ABG • On 21%, add PaCO2 and PaO2 to see if greater than 150. • If one of the three acid base parameters is abnormal, there is an error. • pH 7.58, PaCO2 40, HCO3- 24 • PaO2 cannot be greater than PAO2 on any FIO2.
Analyzing an ABG • Know normal venous values and suspect when a venous sample may have been drawn • Inaccurate FIO2 • Improperly recorded • Patients total flow exceeds flow from delivery device • FIO2 recorded from low flow system • Water in the aerosol tubing
Objectives • Define anemia. • List three types of anemia and state the causes of the defect. • Describe the effect of anemia on the presence of hypoxia. • State the benefit, problems, and specific levels for each of the following as it relates to it being an indicator of cellular hypoxia: • Lactate • Mixed Venous Oxygenation • Oxygen Consumption & Utilization • Gastric Mucosal Acidosis
Hypoxia • Definition: Reduced oxygen levels at the tissue. • No “best” index for assessing tissue oxygenation. • Begin assessment by assessing the components of oxygen delivery: • Dissolved Oxygen • Bound Oxygen • Hemoglobin • Cardiac Output (This will be covered in RSPT 2420) • Then look at markers of the effects of possible tissue hypoxia.
Types of Hypoxia • Hypoxemic Hypoxia • Circulatory (Stagnant) Hypoxia • Anemic Hypoxia • Histotoxic Hypoxia
Oxygenation Indices • Dissolved Oxygen as an index of hypoxia. • Not very useful • Pretty good bet hypoxia is present with severe hypoxemia • Be careful at extremes! • Keep PaO2 above 60 mm Hg. • Combined Oxygen (SaO2) as an index of hypoxia. • Make sure how you know HOW it is reported • SaO2 with nomogram, 2-wavelength oximetry, CO-Oximetry, Pulse Oximetry • Better than PaO2, but has its faults. • Abnormal species of hemoglobin • Insensitive in telling deterioration or at high PaO2 levels.
Anemia • RBC: • 5 million/mm3 in men; 4.5 million/mm3 in women. • Hemoglobin • 15 g% in men, 13 to14 g% in women. • Anemia defined as a reduction in the amount of circulating RBC or hemoglobin. • Hematocrit (formed elements in blood) • 47% in men, 42% in women. • Too low is bad; too high is bad.