Download
1 / 27
270 likes | 379 Views
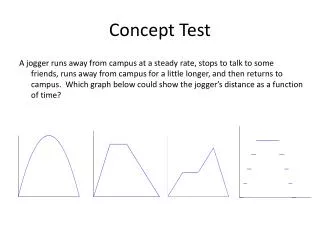
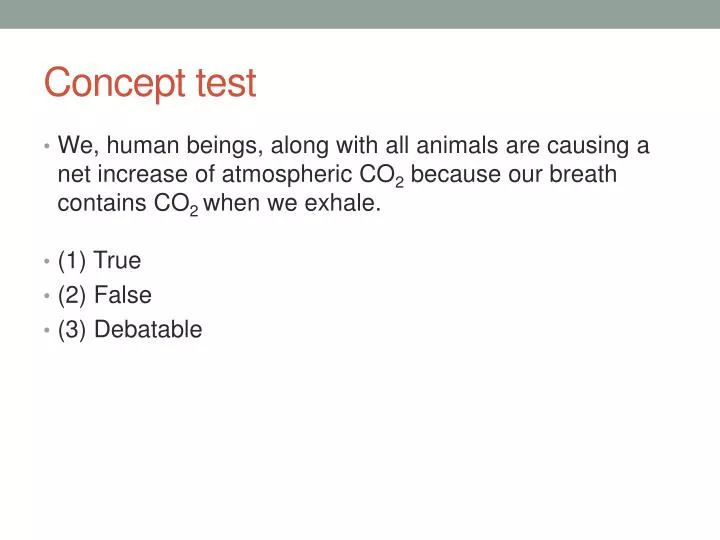
Concept test. We, human beings, along with all animals are causing a net increase of atmospheric CO 2 because our breath contains CO 2 when we exhale. (1) True (2) False (3) Debatable. oxygen cycle. Observations Processes Climate change impacts Future projections.

E N D
Concept test • We, human beings, along with all animals are causing a net increase of atmospheric CO2 because our breath contains CO2 when we exhale. • (1) True • (2) False • (3) Debatable
oxygen cycle Observations Processes Climate change impacts Future projections
Measuring oxygen in the seawater • Oxygen is the third most frequently measured ocean tracer following T and S • Winkler titration method (1888) • Wet chemistry, performed on site • Most accurate • Electronic and optical sensors • Calibration is crucial • Possible to deploy on floats, gliders, etc
Observed variability of oceanic O2 Gruber et al. (2007) • Global ocean deoxygenation? NPIW Stramma et al 2008
Oxygen and marine ecosystem Image from an ROV off the Oregon coast after a low oxygen event Figure 1. Keeling et al., (2010) Low O2 can reduce the respiratory capacity of marine heterotrophs, leading to reduced physiological performance or death.
Glacial-interglacial changes? • The intensity of the North Pacific Oxygen Minimum Zone has varied over the past 100ky. • This has implications for the ocean’s redox chemistry and the overall fertility of the ocean. • Reasons for the O2 changes are unclear. Van Geenet al. [2003]
Global oxygen cycle: processes Vertical profile of observed O2
Controls on atmospheric oxygen • More than 90% of oxygen molecule is in the atmosphere • 20% of atmospheric gas • Opposite tendency relative to CO2 • Source: photosynthesis • Sink: respiration • Geologic timescale • Burial of organic matter leads to atmospheric O2 increase
Oceanic oxygen • Near saturation at the surface • O2 is within a few percent of saturation with atmosphere (high concentrations) • O2 ≈ O2sat(T,S) • Consumed by respiration • Depleted at depth • Hypoxic: below 60 mmolO2/kg • Suboxic: below 5mmolO2/kg
Oxygen Minimum Zone Figure 3a
Ocean vertical motions H L H
Distribution of oxygen-depleted waters • Indo-Pacific is more depleted in oxygen relative to the Atlantic • Oxygen gets depleted in some coastal regions
Oxygen utilization Apparent Oxygen Utilization Temperature Heat content of the ocean Integrated effect of respiration Biological productivity Aging of water masses
Declining oxygen in warming climate Warming and circulation change Temperature increase Slower vertical exchange of waters
Future projection • Model simulations for the 21st century future climate • What are the uncertainties?
Expanding OMZ?! California Current Region Tropical Pacific Region Deutsch et al. (2011) Stramma et al. (2008) Decadal-scale fluctuations or climate trend?
Ocean biogeochemistry model • Divide up the oceans into grid cells • Input: solar heating, rain rate, surface wind, … • Given the state at time=t, predicts for t+1 Initial cond(time=t) T, S, nutrient, carbon, alkalinity Boundary cond: Heating, wind, dust, atmos pCO2, dust… Computer code time = t+1 T, S, nutrient, carbon, alkalinity, biological productivity, …
A hindcast simulation O2 on sq= 26.8 Climatology • Expansion of OMZ during late 20th century • Minimum extent of OMZ around mid 1970s Eastern tropical Pacific O2 Model climatology
ENSO cycle and O2 Compensations +O2 inventory OMZ contraction O2 - AOU -O2 inventory OMZ expansion O2sat Major El-Nino events
The Mechanism: Upwelling and AOU Deutsch et al. (2011) El-Nino La-Nina • Warmer and decreased O2sat • Weaker lateral O2supply • Decreased biological O2 consumption • OMZ contraction • Colder and increased O2sat • Stronger lateral O2 supply • Increased biological O2 consumption • OMZ expansion
Land vs ocean CO2 uptake O2outgassing Slope = a Decline of oceanic O2 Slope = b Accounting for ocean O2outgassing implies that CO2 uptake by land must have been smaller, and ocean CO2 uptake larger than previously thought. + Ocean outgassing
Oxygen, ocean biogeochemistry and climate O2 changes indicate: Changes in ocean circulation and biological productivity Greenhouse effect Changes in the carbon cycle and ocean CO2 uptake. Transport + mixing Photosynthesis + respiration Oceanic carbon, O2 cycle Atmospheric Climate Light, SST, dust Heat, water, momentum exchange Ocean circulation Biological Productivity Nutrient Supply