Download
1 / 31
310 likes | 521 Views
? OSEL 2008. Objective. Present the background and history of measurement within CMMIPlace measurement within the context of CMMI (or CMMI within the context of measurement?)Identify common issues and concerns with measurement within the context of CMMI, and their resolutionLook at some meas

E N D
1. � OSEL 2008
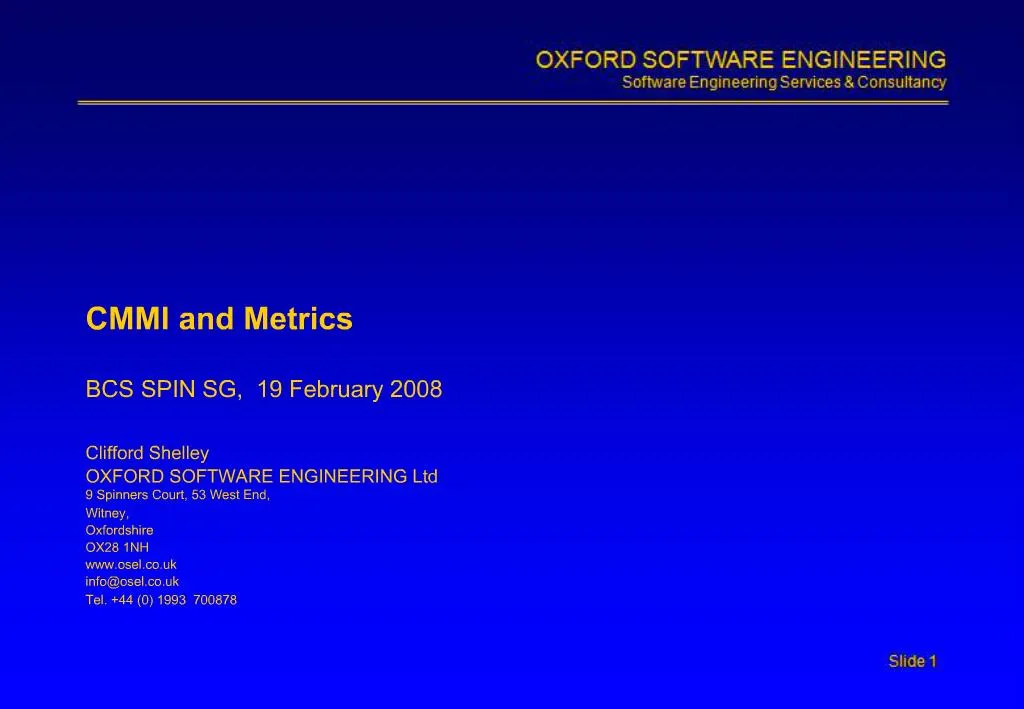
CMMI and Metrics
BCS SPIN SG, 19 February 2008
Clifford Shelley
OXFORD SOFTWARE ENGINEERING Ltd
9 Spinners Court, 53 West End,
Witney,
Oxfordshire
OX28 1NH
www.osel.co.uk
info@osel.co.uk
Tel. +44 (0) 1993 700878 The Copyright in this work is vested in Oxford Software Engineering Limited and the document is issued in confidence for the purpose only for which it is supplied. It must not be reproduced in whole or in part or used in tendering or manufacturing purposes except under an agreement or with the consent in writing of Oxford Software Engineering Limited and then only on condition that this notice is included in any reproduction. No information as to the contents or subject matter of this document or any part thereof arising directly or indirectly therefrom shall be given orally or in writing or communicated in any manner whatsoever to any third party being an individual firm or company or employee thereof without prior consent in writing of Oxford Software Engineering Limited.The Copyright in this work is vested in Oxford Software Engineering Limited and the document is issued in confidence for the purpose only for which it is supplied. It must not be reproduced in whole or in part or used in tendering or manufacturing purposes except under an agreement or with the consent in writing of Oxford Software Engineering Limited and then only on condition that this notice is included in any reproduction. No information as to the contents or subject matter of this document or any part thereof arising directly or indirectly therefrom shall be given orally or in writing or communicated in any manner whatsoever to any third party being an individual firm or company or employee thereof without prior consent in writing of Oxford Software Engineering Limited.
2. � OSEL 2008 Objective
Present the background and history of measurement within CMMI
Place measurement within the context of CMMI (or CMMI within the context of measurement?)
Identify common issues and concerns with measurement within the context of CMMI, and their resolution
Look at some measurement approaches that can be really useful
(it is assumed here that �measurement� is equivalent to �metrics�)
3. � OSEL 2008 Background�
Original SW CMM (a tool to measure software capability)
Included measurement and analysis as a �common feature� � briefly described
Expected product size estimates in planning
Measurement of processes (problematic at L2, expected at L3)
SPC like KPA at L4
4. � OSEL 2008 �Background� Carried forward and developed to CMMI
Staged Representation
ML2
Measurement and Analysis is a PA in its own right
NB: Includes GQM as SP 1.1-1.4
PP requires product sizing
ML3
OPD SP 1.4 - process data defined and collected (using MA)
IPM SP 1.2 � use historical data for estimating
ML4
SPC expectations (OPP)
Control common causes of variation?
Exploited by QPM
ML5
Quantitiative Process Improvement � pervasive measurement
CAR uses measurement as analysis tool
OID uses measurement as an analysis tool
5. � OSEL 2008 �Background Continuous Representation
CL2:
All PAs expected to be monitored and controlled (GP2.8 � measurement is expected)
CL3:
Standard process measures [defined and] stored (GP3.2)
CL4:
Quantitative objectives for processes established (GP4.1)
SPC required - stabilize sub-process performance (GP4.2)
Control special causes of variation � part of process capability as understood by production engineering
CL5:
Establish quantitative process improvement (GP5.1 sub-practice)
Manage common causes too � to enable process capability
6. � OSEL 2008 Measurement within CMMI�
MA PA is the enabler
��is to develop and sustain a measurement capability that is used to support management information needs�
Interpretation?
7. � OSEL 2008 �Measurement within CMMI�
MA Scope
SG1 Align Measurement and Analysis Activities
SP 1.1 Establish Measurement Objectives
SP 1.2 Specify Measures
SP 1.3 Specify Data collection and Storage Procedures
SP 1.4 Specify Analysis Procedures
SG2 Provide Measurement Results
SP 2.1 Collect Measurement Data (includes verification)
SP 2.2 Analyze Measurement Data
SP 2.3 Store Data and Results
SP 2.4 Communicate Results (to aid decision making)
8. � OSEL 2008 �Measurement within CMMI
MA PA � Applicability for ML2
��support management information needs��
Project management (initially)
��at multiple levels in the organization��
and process management (GP 2.8)
and products (product components provided by suppliers)
Not considered explicitly
testing? � testers tend to be a measurement �centre of excellence�
development? � developers don�t (design not amenable to measurement?)
9. � OSEL 2008 Practical concerns 1:
Fear
�I don�t want to be measured�
It is abstract and can be difficult (Pfleeger)
Distinguish between metrics designers and metrics users
and train accordingly
Where does it fit?
Tactical capability or organizational infrastructure, or mix?
10. � OSEL 2008 Practical concerns 2:
What should we measure?
RTFM
SG1
Ask what do you* need to know? Why?
Who monitors and controls (measures)processes
At ML2, at ML3?
Who monitors and controls the MA process?
Metrics Repository
Central/organizaton, or local/project
* �you�, perhaps �we�, but not �they�
11. � OSEL 2008 Common Circumstances 1:
Product sizing rarely done, or done well
Difficulty with identifying entities and their quantitative attributes
Fix: analysts extract identities, counts and attributes of system elements from developer/estimators � start with task based estimation spreadsheet and work upstream, �What were they thinking?�
Organizational Measurement Infrastructure in place
Collects lots of data (if it moves measure it)
No traceability back to objectives (SG1 missing) data is orphaned from rationale � can�t reuse
Fix: discard collected data without definitions or rationale, then reverse engineer objectives (SG1) for existing data collection systems � usually results in opportunity to shed data collection activity � reduce costs � although rarely taken up
Organizational measurement data is unverified � of unknown accuracy
used for admin/billing
Not credible, known to be invalid (timesheets)
Not used by collectors
Data is for reporting, not using
Fix: verify data � presumes SG1
12. � OSEL 2008 Common Circumstances 2:
Good measurement
Developed, owned and used locally, within teams
Can be undervalued (seems obvious)
MA SG1 implicit
There is a limited �information horizon�
Visibility is limited, and may be better that way
Measurement data doesn�t travel well
�Drill down� is limited � even if it looks like it isn�t
13. � OSEL 2008 Good Measurement 1:
Purpose clear and understood by collectors, analysts and decision makes
Measures are defined (not just described)
Data collectors are users (short feedback loops)
Accuracy and validity known (as minimal requirement)
Can stop collecting when no longer needed
14. � OSEL 2008 Good Measurement 2: KISS
Minimal arithmetic, especially multiplication and division
(this includes percentages)
Arithmetic obscures much, reveals little
Non parametric approaches
Robust, widely applicable to �messy� software engineering data
Not the usual statistical approach
Consider �Exploratory Data Analysis� (EDA)
Tukey
Use Graphics
But not pie charts
Let data show its information content � patterns, trends, outliers
Tufte
GQMGtutu
Goal Question Metric, Graphics � guided by Tufte and Tukey
SEI GQ(I)M
SPC
Later, much later
SPC Rule #1, know what you�re doing
15. � OSEL 2008
16. � OSEL 2008
O X F O R D
S O F T W A R E E N G I N E E R I N G
L I M I T E D
9 Spinners Court, 53 West End,
Witney,
Oxfordshire
OX28 1NH
www.osel.co.uk
shelley@osel.netkonect.co.uk
Tel. +44 (0) 1993 700878
17. � OSEL 2008
18. � OSEL 2008 Supplementary Material�
19. � OSEL 2008
20. � OSEL 2008
21. � OSEL 2008
22. � OSEL 2008
23. � OSEL 2008
24. � OSEL 2008
25. � OSEL 2008
26. � OSEL 2008
27. � OSEL 2008 N = 11
Mean of X�s = 9.0
Mean of Y�s = 7.5
Regression line = Y + 0.5X
Standard error of estimate of slope = 0.118
t = 4.24
Sum of squares X � X = 110.0
Regression of sum of squares = 27.50
Residual sum of squares of Y = 13.75
Correlation coefficient = 0.82
R2 = 0.67
28. � OSEL 2008
29. � OSEL 2008
30. � OSEL 2008 Process Capability:
Indices for measuring process goodness
Cp = USL - LSL / 6? or 2T / 6?
Cp < 1 process is incapable
Cp > 1 process is capable (6? processes have Cp of 2)
does not account for process drift so...
Cpk = the lesser of (USL - X) / 3? or (X - LSL) / 3?
31. � OSEL 2008