Download
1 / 33
330 likes | 510 Views
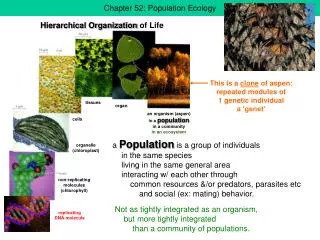
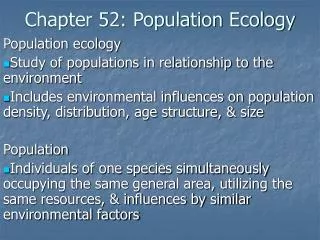
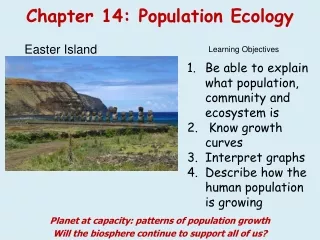
Population Ecology Chapter 55. Environmental Challenge. Ecology: the study of how organisms interact with one another and their environments. Populations : groups of individuals of the same species in one place. Populations. Range : area throughout which a population occurs

E N D
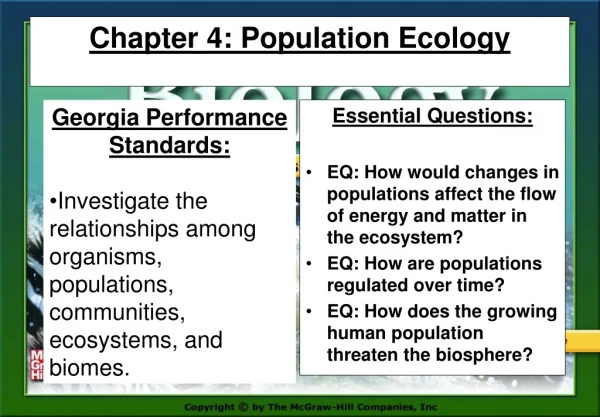
Environmental Challenge • Ecology: the study of how organisms interact with one another and their environments. • Populations: groups of individuals of the same species in one place
Populations • Range: area throughout which a population occurs • Most species have limited geographic range • Devil’s hole pupfish lives in a single spring in southern Nevada
Populations • Humans alter the environment and some species have altered their range in reponse. Range expansion of the cattle egret
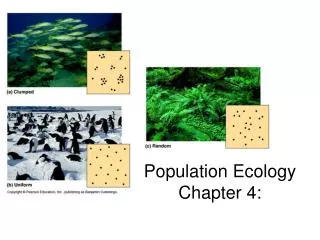
Populations • Dispersion: how individuals in a population are spread out within their range • Random: individuals do not interact strongly with one another. • Uniform: behavioral interactions, resource competition • Clumped: uneven distribution of resources.
Biotic PotentialThe rate of growth for a population if every individual survived and reproduced. • Under such ideal conditions, a population would have exponential growth
b = d Growth levels off as population approaches carrying capacity Exponential growth initially Population Logistic Growth S-Curve Lag phase
Growth and Limits Many populations exhibit logistic growth
Carrying capacity (K): the maximum number of individuals in a species that an environment can support • Determined by the amount of resources available (food, water, nutrients, etc) • Results in logistic growth • Hunting brings pop to Winter K
Demography and Dynamics • Demography: the quantitative study of populations • How size changes through time
Population Changes Calculating growth rates:(Births + I) - (Deaths + E)Immigrants (I) - Individuals moving into a population Emigrants (E) - Individuals moving out of a population (exiting)
Limiting Factors: situations that prevent a population from increasing Density-Independent Factors--do not depend on the number of individuals in the population. --Usually abiotic factors such as pollution, weather events and natural disasters
Density-Dependent Factors-become limiting only when population reaches a certain size-strongest when population is large and dense-usually biotic factors such as food, predators, disease, and competition
Sawtooth Curve: Shows periodic fluctuations (rise and fall) of populations.--Can show density-dependant factors at work (predator-prey)--Can show density-independent factors at work (seasonal changes)
Sawtooth Graph -showing seasonal population fluctuations summer winter
Fluctuations in the number of pupae of four moth species in Germany
North American snowshoe hare 10 year cycle • Two factors generate this cycle: • Food plants • Predators
Reproductive patterns • r-strategist: • produce many offspring in a short period of time (mice, flies) • take advantage of a temporarily abundant resource • k-strategist: • produce a few offspring that have a better chance of surviving with intense parental care (humans, elephants) • Limited resources, pop near carrying capacity
Human Population Growth • K-selected life history traits • Small brood size • Late reproduction • High degree of parental care • Human populations have grown exponentially • Last 300 years birth rate has remained same • Death rate has fallen dramatically
Human population growth:YearEstimated population (in millions)0 A.D. 130 1650 500 1850 1,000 (1 billion) 1930 2,000 1970 4,000 (4 billion) 1998 60005/3/106,817,237,780 U.S. 309,191,081
A.The graph of human population is a J curve. It shows exponential growth Industrial Revolution begins Agriculture begins Bubonic plague Plowing and irrigation
Number of years to add each billion (year) All of Human History (1800) 123 (1930) 33 (1960) 15 (1975) 12 (1987) 12 (1999) 13 (2012) 16 (2028) 26 (2054) Sources: First and second billion: Population Reference Bureau. Third through ninth billion: United Nations, World Population in 2300 (medium scenario), 2003.
What has allowed human populations to grow exponentially? 1.)medicine 2.)plenty of food(agriculture) 3.) sanitation* medical advances allow people to live longer and decreases infant mortality (Child death)
What is Earths’ carrying capacity? • Unknown • J curve will continue until some resource becomes limiting • Some countries have exceeded their carrying capacities: China, Ethiopia, Somalia, India
World Population Clock Source: Population Reference Bureau, 2004 World Population Data Sheet.
Human Population Growth Distribution of population growth
Human Population Growth • Consumption in the developed world further depletes resources • Wealthiest 20% of the world’s population accounts for 86% consumption of resources and produces 53% of CO2 emissions • Poorest countries: 20% is responsible for 1.3% consumption and 3% CO2 emissions
Human Population Growth Ecological Footprint: amount of productive land required to support an individual at the standard of living of a particular population through the course of his/her life