Download
1 / 63
640 likes | 762 Views
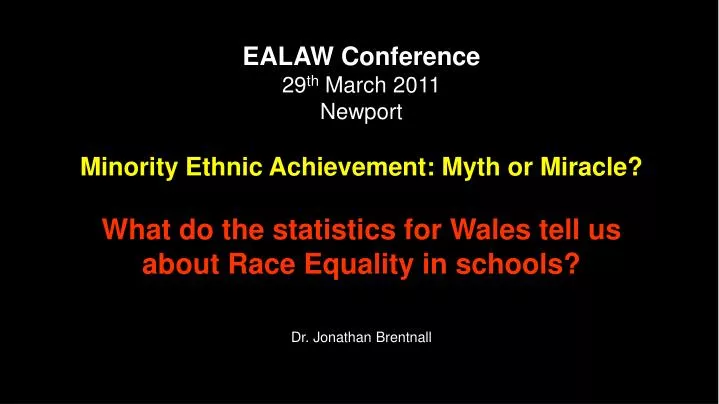
EALAW Conference 29 th March 2011 Newport Minority Ethnic Achievement: Myth or Miracle? What do the statistics for Wales tell us about Race Equality in schools? Dr. Jonathan Brentnall. 1. Big Picture. Context. Inform work with individuals. In the stats – every child matters.

E N D
EALAW Conference 29th March 2011 Newport Minority Ethnic Achievement: Myth or Miracle? What do the statistics for Wales tell us about Race Equality in schools? Dr. Jonathan Brentnall
1. Big Picture Context Inform work with individuals In the stats – every child matters At a social level – every child matters Statistics influence expectations – use them carefully
2. Potential v Attainment Grouped attainment statistics are NOT a measurement of POTENTIAL (group or individual) Only tell you what pupils ATTAINED measured against a particular level at a certain time – not what they’re CAPABLE of
3. Achievement v Attainment A child may ACHIEVE much but NOT ATTAIN a set target level A child may make great progress but still not ATTAIN the level of their peers
4. Assessments contain bias Socially constructed Culturally framed Biased towards those who share a similar social and cultural framework of experience Certain kinds of knowledge, understanding and skills are valued more than others Built-in disadvantage for some
5. Working within the system Curriculum & testing need to be addressed at a political, policy level Some room for professional discretion Tacit acceptance of working within the statutory framework Ultimately – children & people are judged by their level of success in the education system – as it is
6. Racial/ethnic differences or inequalities? Gender pay gap = Unequal Pay Underlying principle – men and women are equal All equal – equal entitlements – equal opportunities – equal access – equal outcomes Different educational/assessment outcomes impact on … further & higher education uptake, career options, earnings, social mobility, quality of life …
7. Explaining the statistics Pupil population divided up by race/ethnicity Ethnic identities - intermediate categories Small numbers = less reliable statistics Aggregated 2005-2010 = more robust statistics Attainment – CSI (Eng, Maths, Sci) KS1-4 Gender KS4 (2005-09), Free School Meals (2009/10), Exclusions (2003-09), EAL Stages (2010)
€ € € € € € € € € € € € € € € € € € € € € € € € € € € € € € € € € € € € € € € € Distribution of attainment in norm-based assessment Number of people Level of attainment
High target level of attainment (few can achieve) Number of people Level of attainment
€ € € € € € € € € € € € € Lower target level of attainment (more can achieve) Number of people Level of attainment
€ € € € € € € € € € € € € € € € € € € € € € € € € € € € € € € € € € € € € € Low target level of attainment (most can achieve) Number of people Level of attainment
€ € € € € € In an EQUAL system - % people attaining the target / expected level % Comparison of different groupings
NC Assessment & exams The statistics represent: All pupils recorded in PLASC on roll & assessed Combined figures for 6 years from 2005-2010 drawn from Statistical bulletins SB 16/2008 (2005-2007) and SB 24/2011 (2008-2010)
L2 L4 L5 A*-C
What do the attainment statistics tell us? Higher proportions of pupils from several minority ethnic groupings attain expected levels: Chinese, Indian, Mixed White & Asian, Any other Asian background, Any other Mixed background In several minority groupings, the proportion of pupils attaining the expected level increases from KS1-4 compared to the national figure: Any other white background, Any other ethnic group, Mixed White and Black African, Pakistani, Bangladeshi
What do the attainment statistics tell us? Some groupings start at a disadvantage: Gypsy/Roma, Traveller, Pakistani, Bangladeshi, Black African, Black Caribbean, Mixed White & Black Caribbean, Any other Black background, Mixed White & Black African, Any other White and Any other ethnic group. Some groupings - proportions decline over time: Gypsy/Roma, Traveller, Black Caribbean, Black African, Mixed White and Black Caribbean, Any other Black backgd. Issues at all Key Stages – most gps decline highest in KS3
Gender & Attainment Are there any differences between boys’ and girls’ attainments?
8.5 8.9 9.8 1.1 8.8 5.4 6.1 6.1 6
10.2 6 11.7 0.6 4.8 1.8 1.5 29.2 2.7 1.8
Gender gap Several groupings with low numbers of attainers - smaller gap betweenboys and girls. Pakistani & Bangladeshi heritage boys behind. Several groupings with high numbers of attainers - larger gap between boys and girls. Chinese, Indian, Any other Asian, Any other Mixed background boys behind.
EAL Stage How significant is EAL proficiency?
FSM eligibility How significant is socio-economic background?