Download
1 / 26
400 likes | 990 Views
Improved Returns on Investments. More rapid and accessible services. Stakeholder. Reduce Re-Activities thru ABC/M. Economic Model Process. Establish Web Based Self Services. Internal Process. Leadership Development. Expand Global Facility Reach. Knowledge Management. Learning & Growth.

E N D
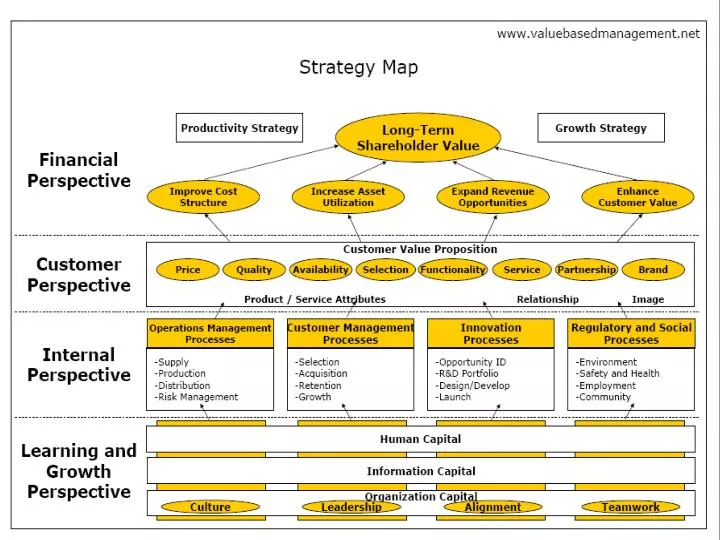
Improved Returns on Investments More rapid and accessible services Stakeholder Reduce Re-Activities thru ABC/M Economic Model Process Establish Web Based Self Services Internal Process Leadership Development Expand Global Facility Reach Knowledge Management Learning & Growth Human Capital IT Infrastructure Facilities and Fixed Assets Investments Strategy Map: Capture a Cause Effect Relationship from the Bottom Up
Extend the Map into Measurements, Targets and Initiatives Strategy Map Detailed statement of what is critical to successfully achieving the strategy How success in achieving the strategy will be measured and tracked The level of performance or rate of improvement needed Key action programs required to achieve objectives Stakeholder Faster Service Access Self Service Applications Objective Description Measure Target Initiative Lean Processes Internal Process Eliminate waste, reworks, and other errors in our processes Number of Reworks 2 per setup per month each Outlet Office Lean / Six Sigma Process and Value Map Analysis Web Enable Technologies L&G Invest in IT Investments
Alignment of Scorecard Components Make sure the components of your scorecard fit together. We want to create a tight model for driving execution of your strategy.
Types of Measurements Measure Type Definition Example Intermediate outcomes that predicts or drive bottom-line performance results Leading Employee turnover rate Bottom-line performance results resulting from actions taken Lagging Employee satisfaction rating Amount of Investments, assets, equipment, labor hours, or budget dollars used Input Number of cashiers Units of a product or service rendered - a measure of yield Output Number of Value Meal orders fulfilled Resulting effect (benefit) of the use or application of an output Outcome Customer satisfaction rating Objective / Quantitative Empirical indicators of performance Wait time Perceptions and evaluations of major customers and stakeholders Customer complaints received as a % of total customers served Subjective / Qualitative
Examples of Measurements by Perspective Internal Processes Shareholder / Customer • Current customer satisfaction level • Improvement in customer satisfaction • Customer retention rate • Frequency of customer contact by customer service • Average time to resolve a customer inquiry • Number of customer complaints • Number of unscheduled maintenance calls • Production time lost because of maintenance problems • Percentage of equipment maintained on schedule • Average number of monthly unscheduled outages • Mean time between failures Learning and Growth Investments • % of facility assets fully funded for upgrading • % of IT infrastructure investments approved • # of new hire positions authorized for filling • % of required contracts awarded and in place • Percentage employee absenteeism • Hours of absenteeism • Job posting response rate • Personnel turnover rate • Ratio of acceptances to offers • Time to fill vacancy
Scoring Measurements Against the Three Selection Criteria A “0” or “1” in any column indicates that you need to revisit this measurement before implementation. 0 = Does not apply 1 = Poor 2 = Acceptable 3 = Good
Some Tools for Determining What to Measure Program Logic Model Process/ System Intermediate Outcomes End Outcome Inputs Output Process Flow Causal Analysis Prototype Product Desired Outcome Acceptable Not Acceptable Results Of Testing Back to Laboratory To Market
How Does the Balanced Scorecard Work? Mission Why we exist Values What’s Important to Us Vision What We Want to Be Strategy How We Achieve Our Vision Strategy Map Translate the Strategy Balanced Scorecard Measure and Focus Targets and Initiatives What We Need to Do Cascading Scorecards and Initiatives What Our Teams and Departments Must Do Personal Objectives What “I” Need to Do Strategic Outcomes Financial Viability Satisfied Internal And External Customers Effective Processes Enabling Investments Adapted from Strategy Maps, Kaplan and Norton, HBS Press 2004
Going from Output to Outcome When you first launch your Initiative, you probably want to use an Output Measurement. Once the Initiative is up and running, change your measurement to an Outcome to see if the Initiative is really having strategic impact.
Strategic Vision County Community Hospital will contribute to the the community by offering accessible quality care tailored to the needs of our residents. Financial Viability Increase Revenue Improve Our Cost Position Customer Provide Patient Access and Service Ensure Physician Satisfaction With Access and Quality of Services Remain a Community Asset Internal Achieve Organizational Commitment to Services Develop Strong PCP & Referral Partnerships Process Improvement: Efficiency/Access Exceed Quality & Safety Standards Match Our Services to Community Need Ensure community focus Employees & Investment Recruit and Retain the Right Employees and Physicians Establish an “Ownership” Culture Ensure the Facility and Technology Meet Requirements
Making the connection to the Baldrige Criteria Malcolm Baldrige Balanced Scorecard Leadership Learning & Growth Perspective Human Resource Capital Learning & Growth Perspective Business Results Measurements and Targets Process Management Internal Process Perspective Strategic Planning Strategy Map Customer Focus Stakeholder / Customer Perspective
Process Perspective “Business Processes” Organization/ Learning Perspective “People” Customer Perspective “Satisfaction” FinancialPerspective “Financial” Measurements viewed through the eyes of customers and/or key stakeholders Financial measures appropriate for internal and external audiences The performance of internal operational processes that have the greatest impact on customer satisfaction & product or service quality The ability to continually innovate and improve Focus Areas for the Scorecard Perspectives The choice of perspectives need to work for your organization. For some applications others include: community, health & safety, and environment
Public Sector View Private Sector View Mission Customer Financial Customer Internal Learning and Growth Internal Learning and Growth Financial Private versus Public Balanced Scorecard The Balanced Scorecard can be adaptive to serve both public and private organizations.
A Strategic Framework for Action • Clarifying and Translating the Vision and Strategy • Clarifying the vision • Gaining consensus • Communicating and Linking • Communicating and educating • Setting goals • Linking rewards to performance measures • Strategic Feedback and Learning • Articulating the shared vision • Supplying strategic feedback • Facilitating strategy review and learning Balanced Scorecard • Planning and Target Setting • Setting targets • Aligning strategic initiatives • Allocating resources • Establishing milestones “The Balanced Scorecard;” Robert Kaplan and David Norton, Harvard Business School Press, 1996
Financial Perspective How do we look to resource providers? Customer Perspective Internal Process Perspective How do customers see us? Are we productive and effective? Innovation & Learning Perspective How do our employees feel? The Balanced Scorecard Source: Kaplan and Norton
EVA Reporting at Best Buy The EVA model: Revenues (Oper Exp) +/- Adjustments =NOPBT (Tax) =NOPAT (Cap Charge) =EVA
ABC/ABM Cost View Cost Assignment View Resources (Provides capacity to do work) Activities (Work performed) Drivers or Factors Cost Object (To what or for whom work is done)
Objectives ProcessView Performance Measures Activities (Work performed) (Why work is done) (How well work is done) ABC/ABM Process View
Activity- Based Costing (ABC) Activities Activity- Based Management (ABM) ABC/ABM Cost/Process Cost Assignment View Resources Resource (Provides capacity to do work) Drivers Performance Measures Cost Drivers ProcessView Activities (Work performed) (Why work is done) (How well work is done) Cost Object Activity (To what or for whom work is done) Drivers
Cost Concepts Direct Service Cost General Government Indirect Cost Total Service Cost Departmental and Divisional Indirect Cost
Steps in the Process Work Unit Costs State-Wide and Department-Wide Costs Costs on Behalf of Work Unit Costs Step One Identify Costs Direct Costs Indirect Costs Allocation Methods KIS Full Cost Or Step Two Assign Costs Activity 1 Activity 2 Activity N Activities Activity 1 Outputs Activity 2 Outputs Activity N Outputs Outputs Step Three Compute Unit Costs Activity 1 Unit Costs Activity 2 Unit Costs Activity N Unit Costs Unit Costs
We cannot solve the problems we have by the same methods by which we have created them. Albert Einstein
EFQM EXCELLENCE MODEL 140 p Processes 14% 150p Key Performance Results 15% People 90p-9% Customer Results 90p-9% 100p Leadership 10% Policy & Strategy 80p-8% People Results 200p-20% Partnerships & Ressources 90p-9% Society Results 60p-6%
Cross-Functional Approach to Managing Core Processes Functions Research/Develop-ment Finance &Admini-stration Sales/Marketing HR Operations Plan the Business Strategy Innovation/Product - Service Generation Cross-FunctionalProcesses CustomerSatisfaction Order Generation Order Fulfilment People Management Servicing Products/Customers