Download
1 / 31
310 likes | 560 Views
Differential gene expression detection, linear models, and Bayesian estimation with limma. Richard Bourgon 16 June 2009 bourgon@ebi.ac.uk. Overview. Differential expression detection Fold change vs. t statistics Bayesian estimation and moderated t statistics

E N D
Differential gene expression detection,linear models, and Bayesian estimation with limma Richard Bourgon 16 June 2009 bourgon@ebi.ac.uk
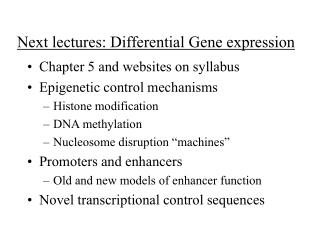
Overview • Differential expression detection • Fold change vs. t statistics • Bayesian estimation and moderated t statistics • Two-sample vs. matched pairs designs • Linear models • Overview and notation • Significant effects, t statistics in the linear model context • Contrasts • Examples using limma • Affymetrix arrays, one channel • Agilent arrays, two-color matched pairs
Differential expression • Comparing two or more conditions to identify genes with significant differential expression:
Preprocessing, expression summaries RLE and NUSE
Differential expression detection • Chronic lymphocytic leukemia example (CLL), processed with RMA. • Multiple probes combined to make one expression summary per array per gene. • One array exhibited inflated NUSE and was discarded. • Genes differ with respect to: • Average log expression in each disease condition. • Variability within each condition. SampleID Disease 1000_at 1003_s_at 1004_at 1 CLL11 progres. 8.351710 6.252244 8.078871 2 CLL12 stable 8.560025 6.484854 8.253037 3 CLL13 progres. 8.206671 6.374078 8.120604 4 CLL14 progres. 8.100480 6.167446 7.990034 5 CLL15 progres. 7.928501 6.145192 7.606213 6 CLL16 progres. 7.798297 6.950057 8.040602 7 CLL17 stable 8.220038 6.382193 7.561939 8 CLL18 stable 7.604526 6.015760 7.635151 9 CLL19 progres. 7.892868 6.738512 7.705114 10 CLL20 stable 7.990593 6.620089 8.902440 11 CLL21 progres. 8.196255 6.075041 7.604097 12 CLL22 stable 8.640604 6.385734 8.154095 13 CLL23 progres. 8.283419 6.172188 8.126358 14 CLL24 stable 7.936140 6.479627 7.604452 15 CLL2 stable 8.535261 6.954652 7.920013 16 CLL3 progres. 8.111849 6.484858 8.999716 17 CLL4 progres. 7.990301 6.132187 8.002255 18 CLL5 progres. 8.087530 6.488099 7.977964 19 CLL6 progres. 8.211420 6.537358 8.366563 20 CLL7 progres. 8.388839 6.258504 7.568752 21 CLL8 progres. 7.958071 6.397895 8.643509 22 CLL9 stable 7.929814 6.289681 8.087157
Effect size and variability “An unfortunate birthmark…”
Fold change and variance • Both genes exhibit a log fold change of ≈ -1.4, but evidence of differential expression is stronger for 33791_at.
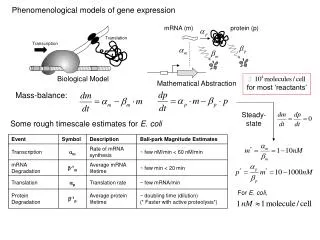
t-statistic • Compare magnitude of average log fold change to level of variability: • The t-statistic has two drawbacks: • Genes with small fold change but even smaller within-group variability, may be highly significant from a statistical, but not a biological point of view. • Small sample estimates of sg can be very noisy.
A Bayesian approach Assume each gene has it’s own noise level within condition: σg. Frequentist: these σg are unknown, but each with a fixed value. Bayesian: these σg are random. Each gene draws its σg, and this determines the noise level for that gene’s observations. If the σgare random, they follow a probability distribution…
limma’s prior distribution for the σg • limma assumes a scaled inverse χ2 prior distribution for the variance terms: • Empirical Bayes: use the data to come up with a sensible guess for the shape and mean parameters. • Why this distribution? • Rich enough to approximate observed array behavior. • Mathematically convenient!
The moderated t-statistic Compare magnitude of average log fold change to level of variability: The prior mean for 1/σ2 is estimated using on all genes on the array: . The posterior mean can be computed by combining the prior and the gene-level variance estimate:
Augmented degrees of freedom • The moderated t is conservatively biased for low-variance genes. • The moderated t follows t-distribution with augmented degrees of freedom:
Moderation: benefits and costs • All variance estimates are “shrunk” towards the global means. Thus, genes with very small observed variance have their estimate pulled up from 0. • The noisy sg sample estimates are shrunk towards the constant (i.e., not noisy) s0. • All genes will have their within-class standard deviation estimate biased towards s0. • The t-statistic has two drawbacks: • Genes with small fold change but even smaller within-group variability, may be highly significant from a statistical, but not a biological point of view. • Small sample estimates of sg can be very noisy.
Linear models and ordinary least squares (OLS) • Recall the RMA intensity model, after background correction, for a gene g: • Suppose you have 4 probes per exon, and just two arrays. There are n = 8 observations, and the model has p = 6 parameters: β: probe effect (nuisance) B: sample effect δ: additive error
A single linear model: 1000_at • Suppose CLL arrays were processed in three batches. Take probe set 1000_at, and check for Disease or Batch effects… > CLL_data SampleID Disease Exp_1000_at Batch 1 CLL11 progres. 8.351710 B 2 CLL12 stable 8.560025 B 3 CLL13 progres. 8.206671 B 4 CLL14 progres. 8.100480 B 5 CLL15 progres. 7.928501 B 6 CLL16 progres. 7.798297 B 7 CLL17 stable 8.220038 C 8 CLL18 stable 7.604526 C 9 CLL19 progres. 7.892868 C 10 CLL20 stable 7.990593 C 11 CLL21 progres. 8.196255 C 12 CLL22 stable 8.640604 C 13 CLL23 progres. 8.283419 C 14 CLL24 stable 7.936140 C 15 CLL2 stable 8.535261 A 16 CLL3 progres. 8.111849 A 17 CLL4 progres. 7.990301 A 18 CLL5 progres. 8.087530 A 19 CLL6 progres. 8.211420 A 20 CLL7 progres. 8.388839 A 21 CLL8 progres. 7.958071 A 22 CLL9 stable 7.929814 B
A possible model: common effect for all batches > CLL_data SampleID Disease Exp_1000_at Batch 1 CLL11 progres. 8.351710 B 2 CLL12 stable 8.560025 B 3 CLL13 progres. 8.206671 B 4 CLL14 progres. 8.100480 B 5 CLL15 progres. 7.928501 B 6 CLL16 progres. 7.798297 B 7 CLL17 stable 8.220038 C 8 CLL18 stable 7.604526 C 9 CLL19 progres. 7.892868 C 10 CLL20 stable 7.990593 C 11 CLL21 progres. 8.196255 C 12 CLL22 stable 8.640604 C 13 CLL23 progres. 8.283419 C 14 CLL24 stable 7.936140 C 15 CLL2 stable 8.535261 A 16 CLL3 progres. 8.111849 A 17 CLL4 progres. 7.990301 A 18 CLL5 progres. 8.087530 A 19 CLL6 progres. 8.211420 A 20 CLL7 progres. 8.388839 A 21 CLL8 progres. 7.958071 A 22 CLL9 stable 7.929814 B > model.matrix( ~ Batch + Disease + 0, CLL_data ) BatchABatchBBatchCDiseasestable 1 0 1 0 0 2 0 1 0 1 3 0 1 0 0 4 0 1 0 0 5 0 1 0 0 6 0 1 0 0 7 0 0 1 1 8 0 0 1 1 9 0 0 1 0 10 0 0 1 1 11 0 0 1 0 12 0 0 1 1 13 0 0 1 0 14 0 0 1 1 15 1 0 0 1 16 1 0 0 0 17 1 0 0 0 18 1 0 0 0 19 1 0 0 0 20 1 0 0 0 21 1 0 0 0 22 0 1 0 1
Same model, alternative encoding > CLL_data SampleID Disease Exp_1000_at Batch 1 CLL11 progres. 8.351710 B 2 CLL12 stable 8.560025 B 3 CLL13 progres. 8.206671 B 4 CLL14 progres. 8.100480 B 5 CLL15 progres. 7.928501 B 6 CLL16 progres. 7.798297 B 7 CLL17 stable 8.220038 C 8 CLL18 stable 7.604526 C 9 CLL19 progres. 7.892868 C 10 CLL20 stable 7.990593 C 11 CLL21 progres. 8.196255 C 12 CLL22 stable 8.640604 C 13 CLL23 progres. 8.283419 C 14 CLL24 stable 7.936140 C 15 CLL2 stable 8.535261 A 16 CLL3 progres. 8.111849 A 17 CLL4 progres. 7.990301 A 18 CLL5 progres. 8.087530 A 19 CLL6 progres. 8.211420 A 20 CLL7 progres. 8.388839 A 21 CLL8 progres. 7.958071 A 22 CLL9 stable 7.929814 B > model.matrix(Exp_1000_at ~ Disease + Batch, CLL_data) (Intercept) DiseasestableBatchBBatchC 1 1 0 1 0 2 1 1 1 0 3 1 0 1 0 4 1 0 1 0 5 1 0 1 0 6 1 0 1 0 7 1 1 0 1 8 1 1 0 1 9 1 0 0 1 10 1 1 0 1 11 1 0 0 1 12 1 1 0 1 13 1 0 0 1 14 1 1 0 1 15 1 1 0 0 16 1 0 0 0 17 1 0 0 0 18 1 0 0 0 19 1 0 0 0 20 1 0 0 0 21 1 0 0 0 22 1 1 1 0
Statistical significance and linear models • Assumptions • We have the correct model: , possibly with many βi= 0. • Given X, the errors are mean 0. • Given X, the errors are independent with common variance σ2. • Ordinary least squares estimation • Given X, is unbiased: • Given X, the covariance matrix for is . Further, we can get an unbiased estimate of σ2 from the sum of squared residuals (dividing by n – p). • If the original errors are Gaussian, then follows the t-distribution. • Even if errors aren’t Gaussian, averaging often makes normal approximation valid.
Statistical significance: Exp_1000_at > summary( lm( Exp_1000_at ~ Disease + Batch, CLL_data ) ) Call: lm(formula = Exp_1000_at ~ Disease + Batch, data = CLL_data) Residuals: Min 1Q Median 3Q Max -0.53661 -0.17220 -0.02199 0.21133 0.49947 Coefficients: Estimate Std. Error t value Pr(>|t|) (Intercept) 8.16596 0.10393 78.575 <2e-16 *** Diseasestable 0.12156 0.13254 0.917 0.371 BatchB -0.07562 0.14575 -0.519 0.610 BatchC -0.14638 0.15383 -0.952 0.354 --- Signif. codes: 0 '***' 0.001 '**' 0.01 '*' 0.05 '.' 0.1 ' ' 1 Residual standard error: 0.2704 on 18 degrees of freedom Multiple R-squared: 0.0646, Adjusted R-squared: -0.0913 F-statistic: 0.4144 on 3 and 18 DF, p-value: 0.7447
The two-sample t-test as a linear model ######## t-test: stable vs. progressive > t.test( Exp_1000_at ~ Disease, data = CLL_data, var.equal = TRUE ) Two Sample t-test t= -0.5969, df = 20, p-value = 0.5573 alternative hypothesis: true difference in means is not equal to 0 ####### Linear model fit > summary( lm( Exp_1000_at ~ Disease, data = CLL_data)) Coefficients: Estimate Std. Error t value Pr(>|t|) (Intercept) 8.10759 0.07025 115.406 <2e-16 *** Diseasestable 0.06954 0.11650 0.597 0.557 --- Signif. codes: 0 '***' 0.001 '**' 0.01 '*' 0.05 '.' 0.1 ' ' 1 Residual standard error: 0.2629 on 20 degrees of freedom Multiple R-squared: 0.0175, Adjusted R-squared: -0.03162 F-statistic: 0.3563 on 1 and 20 DF, p-value: 0.5573
Contrasts • Neither batch B nor batch C are significantly different from batch A (as far as 1000_at is concerned): pB = .61, pC = .35. • Are B and C different from one another? Two approaches…
Contrasts • Neither batch B nor batch C are significantly different from batch A (as far as 1000_at is concerned): pB = .61, pC = .35. • Are B and C different from one another? Two approaches… • Fit a new model and test • Use a contrast and test
Contrasts • Neither batch B nor batch C are significantly different from batch A (as far as 1000_at is concerned): pB = .61, pC = .35. • Are B and C different from one another? Two approaches… • Fit a new model and test • Use a contrast and test
Design matrix for dye swaps • CCl4 data set: • Agilent two-color whole-genome arrays • Rat hepatocytes. • Two treatments: CCl4 or DMSO. • Three levels of RNA quality. • Dye swap, with 3x replication in each direction. • Unmatched model (one RNA quality level): • Matched pairs design:
limma and linear models • Replace , and adjust the degrees of freedom used for the t-tests. • Apply the linear model procedure to every gene interrogated by the array. Genes are analyzed independently — except when computing s0. In particular, the same design matrix X is used for every gene.
Summary • Differential expression can be assessed by fold change,t-statistic, or a moderated t-statistic. Using fold change — if a cutoff can be properly calibrated — is a fully moderated t! • Incorporating variance is important, but has some disadvantages as well, especially for small n. • A Bayesian moderated t addresses these disadvantages, but at the cost of some bias. (Hopefully small and/or conservative!) • Linear models permit estimation and testing of effects. A design matrix establishes the relationship between observations and the parameters of the model. • Contrasts permit estimation and testing of differences between your linear model parameters.