Download

1 / 42
420 likes | 451 Views
1st Level Analysis Design Matrix, Contrasts & Inference. Cat Sebastian and Nathalie Fontaine University College London. What is ‘1 st level analysis’? Design matrix What are we testing for? What do all the black lines mean? What do we need to include? Contrasts What are they for?

E N D
1st Level Analysis Design Matrix, Contrasts & Inference Cat Sebastian and Nathalie Fontaine University College London
What is ‘1st level analysis’? Design matrix What are we testing for? What do all the black lines mean? What do we need to include? Contrasts What are they for? t and F contrasts Inferences How do we do that in SPM5? A B C D Outline [1 -1 -1 1]
1st level analysis: activation is averaged across scans within a subject 2nd level analysis: activation is averaged across subjects (groups can be compared) What question are we asking?: What is 1st level analysis? Which voxels in the brain show a pattern of activation over conditions that is consistent with our hypothesis?
The Design Matrix More on this Time Not so much on this
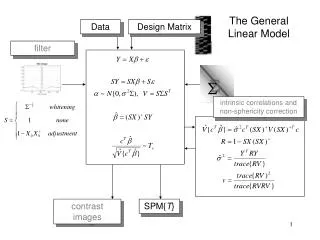
b1 b2 The GLM in fMRI Y= Xx β+ ε Design matrix: Several components which explain the observed data, i.e. the BOLD time series for the voxel Observed data: Y is the BOLD signal at various time points at a single voxel Parameters: The contribution of each component of the design matrix to the value of Y (aim to minimise error) Error: Difference between the observed data, Y, and that predicted by the model, Xβ. Time ´ + =
Time Intensity What is Y? Y • Y is a matrix of BOLD signals • Each column represents a single voxel sampled at successive time points.
The design matrix is simply a mathematical description of your experiment E.g.: ‘visual stimulus on = 1’ ‘visual stimulus off = 0’ It should contain ‘regressors of interest’, i.e. variables you have experimentally manipulated, and ‘regressors of no interest’ – head movement, block effects. Why? To minimise the error term, you want to model as much of Y as possible using variables specified in X What is X (design matrix)?
What should the model look like? E.g. of a regressor of no interest Baseline Regressors of interest Motion Usually 6 motion regressors: 3 translations, 3 rotations X =
There are different ways to specify variables, e.g. Regressors of interest • Conditions: • 'dummy' codes identify different levels of experimental factor • e.g. integers 0 or 1: 'off' or 'on' • Covariates: • parametric modulation of independent variable • e.g. task-difficulty 1 to 6 on off off on
Modelling the baseline This a column of ‘ones’ modelling the constant, or mean signal (the signal is not zero even without any stimuli or task) SPM will model this automatically Two event-related conditions Baseline often used as a reference (not the same as baseline fixation)
Imaging a 2x3 factorial design with factors Modality (Auditory, Visual) and Condition (Concrete, Abstract, Proper) V A C1 C2 C3 From design to a design matrix: an example You can model it like this…but is it the best way? C1: Concrete nouns Visual C2: Abstract nouns C3: Proper nouns C1: Concrete nouns C2: Abstract nouns Auditory C3: Proper nouns
What can we test with this design matrix? • We can test for main effects: - Visual > Auditory? - Concrete > Abstract? • But we can’t test for interactions or simple main effects: Visual/concrete > Visual/Abstract? etc V A C1 C2 C3 The design is not orthogonal…
An orthogonal design matrix C1 C2 C3 C1 C1 C2 C2 C3 C3 V A V A V A V A Just like in SPSS, you need to cross your variables in order to model interactions SPM will do this for you automatically if you have a factorial design – just input the factors and the number of levels
Ways to improve your model: modelling haemodynamics The brain does not just switch on and off. Reshape (convolve) regressors to resemble HRF HRF basic function More on this next week! Original HRF Convolved
b1 Time ´ + = b2 To return to the GLM… Y= Xx β+ ε We calculate beta values for each regressor in the design matrix We can then perform contrasts to see which regressors make a significant contribution to the model
We want X to model as much of Y as possible, making the error term small – therefore model everything! This will ensure that the beta values associated with your regressors of interest are as accurate as possible Make sure you specify a new regressor for each crossed variable of interest (orthogonality) Additional complications (basis functions and correlated regressors) will be covered next week Contrasts can then be performed...over to Nathalie Interim summary: design matrix
What is ‘1st level analysis’? Design matrix What are we testing for? What do all the black lines mean? What factors do we need to include? Contrasts What are they for? t and F contrasts Inferences How do we do that in SPM5? A B C D Outline [1 -1 -1 1]
General Linear Model (GLM) characterises relationships between our experimental manipulations and the observed data Multiple effects all within the same design matrix Thus, to focus on a particular characteristic, condition, or regressor we use contrasts What are they for?
What are they for? • A contrast is used by SPM to test hypotheses about the effects defined in the design matrix, using t-tests and F-tests • Contrast specification and the interpretation of the results are entirely dependent on the model specification which in turn depends on the design of the experiment
Clear hypothesis / question Clear design to answer the research question The contrasts and inferences made are dependent on choice of experimental design Most of the problems concerning contrast specification come from poor design specification Poor design: Unclear about what the objective is Try to answer too many questions in a single model We need to think about how the experiment is going to be modelled and which comparisons we wish to make BEFOREacquiring the data Some general remarks
E.g.: Contrasts with conditions: The conditions that we are interested in can take on a positive value, such as 1 The conditions that we want to subtract from these conditions of interest can take on a negative value, such as -1 Contrasts
Condition 1: Language task Condition 2: Memory task Condition 3: Motor task Condition 4: Control Contrast 1: Language minus Control: 1 0 0 -1 Contrast 2: Motor minus Memory: 0 -1 1 0 Contrast 3: Control minus Motor: 0 0 -1 1 Contrast 4: (Language + Memory) minus Control: 1 1 0 -2 This contrast will measure areas of the brain that have significantly increased activity in the average of the language and memory conditions, compared with the control condition – another way of looking at this contrast is the sum of the individual condition contrasts of 1 0 0 -1 and 0 1 0 -1. Contrasts
SIMPLE MAIN EFFECT A – B Simple main effect of motion (vs. no motion) in the context of low load [ 1 -1 0 0] MAIN EFFECT (A + B) – (C + D) The main effect of low load (vs. high load) irrelevant of motion Main effect of load [ 1 1 -1 -1] INTERACTION (A - B) – (C - D) The interaction effect of motion (vs. no motion) greater under low (vs. high) load [ 1 -1 -1 1] Contrasts - Factorial design MOTION NO MOTION A B C D LOW LOAD HIGH A B C D A B C D A B C D
t-test: is there a significant increase or is there a significant decrease in a specific contrast (between conditions) – directional F-test: is there a significant difference between conditions in the contrast – non-directional Contrasts
Two event-related conditions The subjects press a button with either their left or right hand depending on a visual instruction (involving some attention) We are interested in finding the brain regions that respond more to left than right motor movement Example
t-contrasts Left Right Mean • t-contrasts are directional • To find the brain regions corresponding more to left than right motor responses we use the contrast: T = [1 -1 0]
contrast ofestimatedparameters c’b t = t = varianceestimate s2c’(X’X)+c t-contrasts • A one dimensional contrast So, for a contrast in our model of 1 -1 0: t = (ß1x1 + ß2x-1 + ß3x0) Estimated variance
Brain activation: Left motor responses This shows activation of the contralateral motor cortex, ipsilateral cerebellum, etc.
F-contrasts Left Right Mean • F-contrasts are non-directional • To test for the overall difference (positive or negative) from the left and right responses we use: [ 1 0 0 ; 0 1 0 ]
Additionalvarianceaccounted forby tested effects F = Errorvarianceestimate F-test • To test a hypothesis about general effects, independent of the direction of the contrast • A collection of t-contrasts that you want to test together
Brain activation Areas involved in the overall difference (positive or negative) from the left and right responses (non-directional)
Design and contrast SPM(t) or SPM(F) Test [1 -1 0] t-test [ 1 0 0 ; 0 1 0 ] F-test
Inference about the effect in relation to: The within-subject variability (1st level analysis) The between subject variability (2nd level analysis) This distinction relates directly to the difference between fixed and random-effect analyses Inferences based on fixed effects analyses are about the particular subject(s) studied Random-effects analyses are usually more conservative but allow the inference to be generalized to the population from which the subjects were selected Inferences about subjects and populations More on this in few weeks!
One voxel = One test (t, F) amplitude General Linear Model • fitting • statistical image time Statistical image (SPM) Temporal series fMRI voxel time course From Poline (2005)
Important consideration in neuroimaging = the tremendous number of statistical tests computed for each comparison E.g.: if 100,000 voxels are tested at a probability threshold of 5%, we should expect: 5000 voxels will incorrectly appear as significant activations = Apparent activations by chance; FALSE POSITIVE Choosing a statistical threshold
Uncorrected threshold of p < .001 Familywise Error (FWE) Bonferroni correction E.g.: .05/100,000 = .0000005 False Discovery Rate (FDR) Adjusts the criterion used based on the amount of signal present in the data Reduce the number of comparisons E.g.: Instead of examining the entire brain, examine just a small region IMPORTANCE of taking into account the multiple comparisons across voxels BUT also the multiple comparisons across contrasts (i.e., the number of contrasts tested) Choosing a statistical threshold
Contrasts are statistical (t or F) tests of specific hypotheses t-contrast looks for a significant increase or decrease in a specific contrast (directional) F-contrast looks for a significant difference between conditions in the contrast (non-directional) Importance of having a clear design Inferences about subjects (1st level) and populations (2nd level) Importance of considering the multiple comparisons Summary
Human Brain Function 2, in particular Chapter 8 by Poline, Kherif, & Penny (http://www.fil.ion.ucl.ac.uk/spm/doc/books/hbf2/pdfs/Ch8.pdf) Introduction: Experimental design and statistical parametric mapping, by Friston Linear Models and Contrasts, PowerPoint presentation by Poline (April, 2005), SPM short course at Yale Previous years’ slides CBU Imaging Wiki (http://imaging.mrc-cbu.cam.ac.uk/imaging/PrinciplesStatistics) (http://imaging.mrc-cbu.cam.ac.uk/imaging/SpmContrasts) SPM5 Manual, The FIL Methods Group (2007) An introduction to functional MRI by de Haan & Rorden References