Download
1 / 21
210 likes | 384 Views
SMART GRID: VISION, OPPORTUNITY AND EFFECTIVENESS. Andrew Tang Senior Director Smart Energy Web November 13, 2009. Pacific Gas and Electric Company. Energy services to 15 MM people: 5.1 MM Electric accounts 4.2 MM Natural Gas accounts 70,000 square miles with diverse topography

E N D
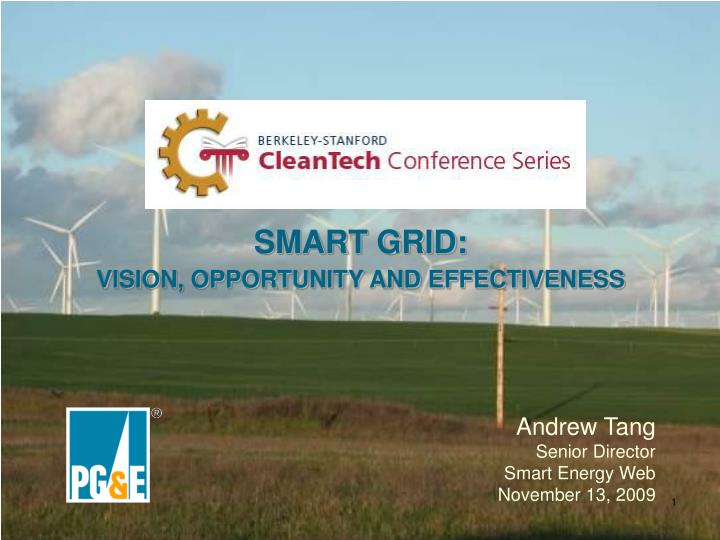
SMART GRID: VISION, OPPORTUNITY AND EFFECTIVENESS Andrew Tang Senior Director Smart Energy Web November 13, 2009
Pacific Gas and Electric Company • Energy services to 15 MM people: • 5.1 MM Electric accounts • 4.2 MM Natural Gas accounts • 70,000 square miles with diverse topography • 123,054 circuit miles electric distribution lines and 18,610 circuit miles of interconnected transmission lines • Peak load: 22,554 MW on July 25,2006 • A regulated investor-owned utility Ranked the greenest utility in the United States
2020 LargeHydro Nuclear Renewable* NaturalGas *With 33% RPS Other PG&E Projected Power Mix 2009 Other Nuclear NaturalGas LargeHydro Renewable Coal
Changing Mix of Renewable Resources 34.8 TWh 72.3 TWh 77.6 TWh 22.5 TWh Source: California Public Utilities Commission, July 2009
Distributed Generation Is Growing Rapidly 40% of US solar PV interconnections are in PG&E’s service territory
PV Solar Is Concentrated 596 cities Average = 57 Median = 12 Mode (86 cities) = 1 Top 20 cities = 38% of total
PEV Charging Creates A Significant Increase In Load Customers will prefer a 240V charge to shorten recharge times PEV charging is a large load for PG&E customers, comparable to average peak summer load of a single home 16 hours BEV Recharge time 8 hours 4 hours 120V/12A 240V/15A 240V/30A Rate of charge Source: http://www.nissanusa.com/leaf-electric-car/#/charging, August 14, 2009
Projected Electric Vehicle Growth High (845) Average (532) Thousands of EVs HEV Historical Low (219) Cumulative PG&E Service Territory PEV Market Adoption Scenarios * Shifted 10 years forward
Left Unmanaged, PEV load will add to peak electric demand 24 Hour Total Loading of Single Feeder - July 27, 2007 12000 11000 10000 9000 When most customers arrive home 8000 off-peak load Total Loading at Substation (KW) 7000 6000 Base Load Scenario (no PHEV) Case 1:- Do nothing (charge @6pm) 5000 Case 2:- TOU rates only (charge @9pm) Case 3:- TOU rates and Smart Charging (charge @9pm-1am) 4000 0 1 2 3 4 5 6 7 8 9 10 11 12 13 14 15 16 17 18 19 20 21 22 23 Hours Source: EPRI. Note: Feeder of Northeastern utility feeder during urban summer peak with 2,778 residential customers. PEV penetration = 10%. Case 1 – 3 charge @ 240V, 12A
= 25 HEVs HEV density 2004 – 2008: A Tale of Two Cities Fresno CA: • New registrations: 83K • HEV registrations: 2K • 2.4% new registrations HEVs • HEV zip code median: 11 Source: Polk & Company, DMV new car registrations.
= 25 HEVs Load Management Critical To Handle Secondary Distribution Impacts Berkeley CA: • New registrations: 14K • HEV registrations: 2.5K • 18% new registrations HEVs • HEV zip code median: 212 Source: Polk & Company, DMV new car registrations.
Peak = 2X Base Load Intermittent Renewables Local Concentrations of EVs Local Concentrations of DG Four Challenges
Overlay with intelligence and automation Sense Communicate Compute Control A Smart Grid PowerPlants Transmission Networks Substations Distribution Networks Consumers
Customer Energy Management Network SmartMeter™ Communications Network Radio Radio Basic Meter Advanced SmartMeter™ Electric Meter • Automated meter reading for all customers • Frequent meter reads • Platform for future innovations • Solid-state technology • Integrated remote connect / disconnect, load-limiting switch • Home Area Network (HAN) gateway
Customer Benefits Today Online Energy Use Data • Displays hourly electric use by day • View data by billing cycle, month, or week • Customer service reps can view graphs SmartRate pricing plan • 10,000 voluntary participants in 2008; 30,000 in 2009 • 2008: Across 9 called events, the average residential customer achieved a reduction of 16.6% • 2009: 15 called events, 86% highly satisfied, 97% intend to continue on plan
Next Step: Customer Energy Management Pilot From meter to the home: • Timely price signals • Appliance / energy management control signals From meter to utility: • Customer electric use • Customer energy generation (e.g. solar) • Appliance response to energy management control signals Internet CEM network communication SmartMeter communication
Test technical integration of smart meter, HAN, smart port and electric vehicle Validate ability to manage peak loads using smart charging with plug-in electric vehicles Explore customer behavior using smart ports with time-of-use pricing, demand response and renewable generation Serving New Loads: PG&E’s Smart Charging Pilot
4 MW / 32 MWh sodium sulfur (NaS) battery Goal to improve reliability and power quality Test ability to provide ancillary services Load-following Frequency regulation Test ability to cost-effectively integrate intermittent renewable resources Integrating Renewables: PG&E’s Utility-scale Battery Pilot The NAS battery installation at Tokyo Electric Power Co.'s Ohito Substation is rated at 6 MW/48 MWh
Leading Industry Work on Smart Grid Standards • Required by Energy Independence and Security Act (EISA) of 2007 • Seeks a standard architecture to enable “plug and play” capability • Create markets • Industry-led effort coordinated by NIST and supported by EEI
Challenges On The Horizon • Policy • Technology • Consumer Adoption