Download

1 / 39
621 likes | 1.21k Views
Chartwork and Tides. We will cover. The Earth Chart Projections The Chart Buoys and the Buoyage System Tidal Times Ranges and Currents Bearing and Distance Where to Dive GPS. The Earth. A sphere which rotates about its axis. Extremities, the North and South Poles.

E N D
We will cover • The Earth • Chart Projections • The Chart • Buoys and the Buoyage System • Tidal Times Ranges and Currents • Bearing and Distance • Where to Dive • GPS
The Earth • A sphere which rotates about its axis. • Extremities, the North and South Poles. • Rotates from West to East. • Equator divides the earth.
Latitude • Angular distance from the centre to a point on the earth’s surface • North and South of the Equator • 0 degrees at the equator • 90 degrees at the poles
Longitude • Half a great circle from Poles • Angle measured at the Equator • Greenwich Meridian at 0° • East or West of Greenwich • International Date line at 180°
Position Fixing • Latitude and Longitude form a grid reference • Divide into degrees and Minutes
Distance on the ChartOn the Latitude scale 1° = 60 Minutes 1 Minute = 1 Nautical Mile = 6076 Feet = 1852 Metres = 10 Cables (1 Cable = 200 Yards) Dublin Port 53°20’.60N 06°08’.09W Cobh 51°50’.00N 08°19’.00W Killybegs 54°36’.90N 08°26’.80W
Chart ProjectionsMercator Projection: • Distance between Longitude lines decrease as you move north and south from the equator • Distance scale varies • Use Latitude scale opposite area of navigation
Chart ProjectionsGnomic Projection • Projecting lines of Latitude and Longitude onto a flat surface which touches the sphere at one point.
The Chart • British Admiralty Charts, normally Mercator projections • High quality tough paper • Rolled up or folded along its normal folds • Use a soft 2B pencil & soft eraser Admiralty publication: ‘Home Waters Catalogue, Admiralty Charts and other Hydrographic Publications’
Chart Information • Title and Number • Scale • Soundings • Chart Corrections REPUBLIC OF IRELAND - EAST COAST ARKLOW to the SKERRIES ISLAND DEPTHS in METERS SCALE 1:100,000 at Lat 53°30’
Symbols and Abbreviations (Admiralty Chart 5011) • Compass Rose • True North • Magnetic North • Variation
Buoys and the Buoyage System • I.A.L.A Buoyage System • The direction of buoyage
Buoy Fitted with Light Lateral Marks • Mark a channel within a harbour, river or estuary • Port Hand Lateral Marks (RED) Can Buoy Can Pillar Buoy Spar Buoy
Lateral Marks • Mark a channel within a harbour, river or estuary • Starboard Hand Lateral Marks (GREEN) Conical Conical Pillar Spar
Cardinal Marks • Mark the navigable (or safe) water to the named side of the mark • Topmark Cones • Colour • Light
Safe Water Marks • Indicate navigable water all around the mark Spherical Spherical Pillar Spar
Safe Water Marks • Indicate navigable water all around the mark • Isophase (Iso) • Occulting (Oc) • Long Flashing (LF) • Flash Morse Code (Mo)
Isolated Danger Marks • May mark a rock or shoal offshore with navigable water all around Pillar Spar
Special Marks • Indicate areas like recreational zones, military exercise areas, cable or pipe lines and spoil grounds
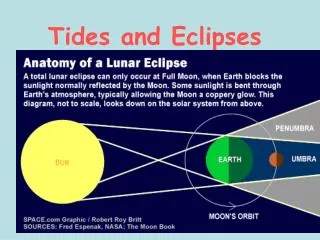
Tidal Times • Referenced to the standard ports • UT(GMT) & (B.S.T.) • Heights above Chart Datum
Tidal Times • Wicklow on July 3rd • High water at: 10:35 + 1h – 41min 10:54, 3.91m • Low water at: 22:59 + 1h – 41min 23:18, 0.91m
Example: Wicklow on July 3rd. at 1354 ? H.W. at Wicklow 1054, 3 hours after H.W. Range: 3.91 - 0.91 = 3.00 Meters. 1/12th.: 3.00/12 = 0.25 Meters. 3 Hrs. after H.W. the Height of Tide is: 1/12th. + 2/12th.+ 3/12th. = 6/12th. Height is: 6 X 0.25 = 1.5 Meters. Height above Chart Datum = 1.5 + 0.91 = 2.41m
Tidal Currents • Tidal Arrows • Tidal diamonds
Tidal Currents Example: Speed and direction of the tide at position A on July 3rd. at 14.00 ? High tide is given as 1035 GMT, 1135 (add 1 hour). 1400 is therefore in the third hour after high water. Direction of the tide is 205°T. Note: Close to spring tide, heights are near maximum, (Black dot). Speed of the tide is 3.3kn. Not a good time to dive at this location.
Time Time = Distance/Speed or Speed = Distance/Time or Distance = Speed x Time Boats speed is 20 Knots, how long for 8 miles ? Time = Distance / Speed Time = 8 / 20 = 0.4 Hour = 0.4 x 60 Minutes. = 24 Minutes.
Observed Position ‘Fix’ Position Line
Observed Position ‘Fix’ Transit
Observed Position ‘Fix’ Dead Reckoning Note: This method does not take account of tidal or wind influences
Wreck: swept by wire to the depth shown. Wk 18 Wreck: depth has be obtained by soundings. Wk 20 Wreck: portion of the superstructure at chart datum. Where to Dive
Overfalls & Tide-rips Where to Dive Rocks Reefs Currents
GPS • Global Positioning System • Accurate world-wide position fixing • 21 operational satellites • 12 hour orbits at 10,900 Meters
Summary • The Earth • Chart Projections • The Chart • Buoys and the Buoyage System • Tidal Times Ranges and Currents • Bearing and Distance • Where to Dive • GPS