Download
1 / 33
330 likes | 471 Views
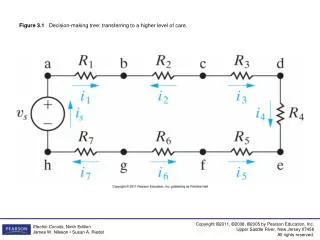
IMS802. ACT-R : A Theory of Higher Level Cognition and Its Relation to Visual Attention. John R. Anderson, Michael Matessa , and Christian Lebiere. 2010. 09. 16. Graduate School of Information Management & Security Ergonomic Design Lab . Seong Min, Kim. Table of Contents.

E N D
IMS802 ACT-R : A Theory of Higher Level Cognition and Its Relation to Visual Attention John R. Anderson, Michael Matessa, and Christian Lebiere 2010. 09. 16 Graduate School of Information Management & Security Ergonomic Design Lab. SeongMin, Kim
Table of Contents 1. Introduction 2. A theory of the visual interface 3. Visual attention 4. Application to menu-selection data 5. Conclusions
1. Introduction Applied & extended domain • ACT-R good model • : the Tower of Hanoi, mathematical problem solving in the classroom, navigation in a computer maze, • computer programming, human memory, and other tasks. • ACT-R failed in HCI • : Ignored many of the details by which the subject interacted with the external environment. • - Involved people reading a computer screen and using a mouse and a keyboard • - No theory of how the “input” and “output” took place • - “Disembodied cognition” : Kieras and Meyer’s (1994) terms • The goals of this paper • - Describe • 1. The visual attention and how it relates to the ACT-R theory of higher level cognition. • 2. Its application to some classic paradigms in visual attention to establish its credibility. • 3. Its extension to menu-selection task and its ability to make some novel predictions about that task.
1. Introduction - cont’d - ACT-R theory review • Two types of knowledge : declarative and procedural knowledge • 1. Declarative knowledge (declarative module) • - “George Washington was the first president of the United States”, “Three plus four is seven” • 2. Procedural knowledge (central module, production rule) • All productions in ACT-R have this basic character • - Responding to some goal, retrieving information from declarative memory, • and possibly taking some action or setting a subgoal. • In ACT-R, cognition proceeds step by step by the firing of such production rule.
2. A theory of the visual interface ACT-R issues • Theories of higher level cognition typically ignore lower level processes such as visual attention and • perception. • Create two stress (or issues) for the plausibility of the resulting models • 1. By assuming a processed representation of the input, the theorists are granting themselves unanalyzed • degree of freedom in terms of choice of representation • - Model depends on the theory of the higher level processes or on the choice of the representation ? • 2. Ignoring significant problems in access to that information such as accuracy and latency • - Visual input often contains more information than can be held in a single fixation • - Shifts of attention may become a significant but ignore part of the processing
2. A theory of the visual interface - cont’d - Approach to visual interface • Remove implicit about how our theory related to the behavior we saw from our subjects. • - Same environment condition : ACT-R simulation interact with same computer screen and software • software not distinguish whether the keystrokes and mouse motions • - Basically, ACT-R simulation can operate the computer application just as a subject can. • We have embedded within ACT-R a theory that might be seen as • - A synthesis of Posner’s (1980) spotlight metaphor • - Treisman’s feature-synthesis model (Treisman & Sato, 1990) • - Wolfe’s (1994) attentional model • → Provide us with a set of constraints that we can then embed within the ACT-R
2. A theory of the visual interface - cont’d - Approach to visual interface • Basic over view of the system : three entities • 1. ACT-R system • 2. Environment with which • the system is interacting • 3. Iconic memory • which is a feature representation • of the information on the screen
3. Visual attention General comment • ACT-R’s theory of visual attention is concerned with how ACT-R finds and extracts information from • the iconic memory in Figure 1. • - The information in the visual icon consist of features→ chunk • - Constraint from spotlight metaphor • In order for the ACT-R theory of higher level processing to “know” what is in its environment, • it must move its attentional focus over the visual field. • - In ACT-R, the calls for shift of attention are controlled by explicit firing of production rules. • - Constraint from feature-synthesis model • What information can ACT-R use to guide where it looks on a screen ? • - ACT-R can (a) look in particular locations and directions • (b) look for particular feature • (c) request to scan for object that have not yet attended • - Constraint from attentional model
3. Visual attention - cont’d - General comment • ACT-R can conjoin these in scanning requests, asking for things like, • “Find the next unattended pink vertical bar to the left of the current location” • 1. ACT-R can search for a conjunction of visual features (pink and vertical). • 2. ACT-R can specifically restrict itself to unattended objects • (“inhibition of return” is not modeled in the ACT-R visual component.) • A final general comment is that ACT-R can select the scale of the features for which it searches and the size • of the object it is recognizing. • - Letters or words ? • - Either the H or Xs comprising the H.
3. Visual attention - cont’d - Sperling Task • Sperling (1960) reported a now-classic study of visual attention. • 1. Whole-report condition • - Presented subjects with brief presentations (50msec) of visual arrays of letters (3-row, 4-column) • - Found that on average, subjects could report back 4.4 letters.
3. Visual attention - cont’d - Sperling Task • Sperling (1960) reported a now-classic study • of visual attention. • 2. Partial-report condition • - Gave subjects an auditory cue to identify • which row they would have to report. • - Found that they were able to report 3.3 • letters in that row. • - Delayed the presentation of the auditory • cue to 1 sec after the visual presentation, • subject’s recall fell to about 1.5 letters. • → Subjects have access to all of the letters • in a visual buffer but that they have • difficulty reporting them before • the letters decay.
3. Visual attention - cont’d - Sperling Task • Sperling (1960) experiment have two dimensions of significance. • 1. Information about the limitations of visual sensory memory • 2. How fast visual attention can move over an array, which is quite relevant to many domains, including • the processing of computer screens. • → the ACT-R theory of visual attention can model this result.
3. Visual attention - cont’d - Sperling Task • ACT-R Simulation When a report row is not identified, the following production would apply After a row has been identified, different products would fire depending on the tone If no tone is presented, Encode-Screen will encode any letter in the array, whereas, if a tone is presented, productions like Encode-Top-Row will encode letters in the cued row. After the visual array disappears, the following production is responsible for report
3. Visual attention - cont’d - Sperling Task • The number of letters encoded in the whole-report procedure is essentially equal to • number of Encode-Screen productions that can fire before the iconic memory of the letters disappears. • - Physically, the stimulus is presented for only 50 msec, • but the critical issue is the duration of the stimulus in the system - a parameter we estimate to be 4.4 times • - Duration of the image to be 810 msec • - Time per production to be 185 msec(810 / 185 = 4.4) • → Attention to move
3. Visual attention - cont’d - Sperling Task • Partial-report condition • - A one-in-three chance of guessing the right row. (able to report the four letters) • - A two-in-three chance of guessing wrong, • in which case they would only start encoding the row after switching to that row. • - Assumed that there were some delay in time for the tone to be perceived • and for attention to switch to the correct row • → Switch-over delay to be 335 msec • = 150 msec to register the signal +185 msec for an attention-changing production to fire • The effective time spent encoding an array if the tone is presented tmsec after • the array will be 810 - t - 335 msec. • - Predicted number of digits reported is:
3. Visual attention - cont’d - Sperling Task • The ACT-R model of this task is very simple and consists of the production rules given plus a rule to • switch from attending to reporting. • - ACT-R model makes clear both the control structure of task and the need to postulate the switching time • 335 msec. (Critical number is 185 msec for switching attention.)
3. Visual attention - cont’d - Subitizing Task • Figure 5 illustrates the classic result obtained (Jensen, Reese, & Reese, 1950) in the task • - There is about a 50 msec slope until three or four items and approximately a 275 msec slope afterward.
3. Visual attention - cont’d - Subitizing Task • ACT-R Simulation Startwill move attention to some part of the screen. See-one, See-two, See-Threewill apply to initialize the count. Attend-Anotherwill move attention to other unattended objects. Add-onewill add one to the count. Stopwill report the count. [Assumption] There are special productions that recognize one object, two objects (e.g., lines), three objects (e.g., triangles), and familiar configurations of larger numbers of objects (e.g., the five on a die face) and that there is a production that can count single objects. (Manfler and Shebo, 1982)
3. Visual attention - cont’d - Subitizing Task • There are several noteworthy aspects of this model. • 1. ACT-R’s ability to tag items in the visual array as attended so that double counts are avoided. • 2. Beyond three, subitizing depends on retrieval of counting facts. • The most important issue : the 275 msec slope that holds beyond four digits. • - In fitting this data, we assumed a 185 msec time to swtichattention (Sperling Task) • - However, ACT-R does predict the 275 msec slope • → An additional 90 msec to retrieve the counting fact in production Add-One.
3. Visual attention - cont’d - Visual Search Task • In Shiffrin and Schneider’s (1997) Experiment 2 • 1. Varied-mapping condition : both distractors and the memory-set items were letters. (same pool) • 2. Consistent-mapping condition : the memory set was composed of numbers, and the distractors were • letters (different pool) • - In general, judgment times increase with memory-set size and frame-size, • but the effects are much stronger for the varied-mapping condition.
3. Visual attention - cont’d - Visual Search Task
3. Visual attention - cont’d - Visual Search Task • ACT-R Simulation • 1. Preparing • - Upon receipt of the memory set, an effort was made to find a feature common to all members of • memory set. • 2. Search • - ACT-R directed attention to a location on the basis of the target set of features. • 3. Judgment • - Consistent-mapping condition : judging whether the item was a number • - Varied-mapping condition : necessary to determine if the item was in the memory set • → By a production pattern match test whose time increased with the size of set. • (Analogus to the existing ACT Model for fan experiments and Sternberg task)
3. Visual attention - cont’d - Visual Search Task
3. Visual attention - cont’d - Visual Search Task • The consistent-mapping condition : two advantages over the varied-mapping condition. • 1. Fewer positions will have to be examined • 2. The target set did not have to be examined during judgment (not suffer a fan effect) • This model required four parameters • 1. A base reaction time (BASE, 208 msec) • 2. An additional waiting time associated with Terminate-No for a negative response (NEG, 133 msec) • 3. A time to attend to a position (SHIFT, 186 msec) → Sperling task (185 msec) • 4. A fan time per element (FAN, 40 msec) → the slope in the typical Sternberg (1969) task
3. Visual attention - cont’d - Conclusions • In each of three tasks, we were able to fit the data assuming just about 185 msec to switch attention. • - In Sperling task, attention switching was the only activity. • - In the subitizing task, there was also time required to set up and increment a count. • - In the Shiffrin and Schneider (1997) task, judgment time played a significant role.
4. Application to menu-selection data Past study review • Nilsen(1991) data (described by Kieras and Meyer (1994) in their report of the EPIC model) • -A linear function is obtained with a slope of 103 msec per position.
4. Application to menu-selection data - cont’d - Our study • The items in the menu are ordered randomly. • - A critical component to latency : Serial search of the list looking for target item • - When the target position is unknown, time is dominated by visual search. • Our model for this task : same model as we proposed for Shiffrinand Schneider’s (1977) data. • - The two critical productions are :
4. Application to menu-selection data - cont’d - Our study • Using the estimate (from Shiffrin & Schneider, 1977) of 186 msec for a shift of attention • -186 × 0.53 = 99 msec per menu item, which closer to the slope (103 msec) in the Nilsen (1991) data. • ※ Probability of feature overlap : 0.53 (McClelland and Rumelhart ,1981) • Kieras and Meyer’s (1994) EPIC model is able to an equally good job assuming a pipeline model whereby • there are eye movements every 103 msec • - As a very improbable speed of eye movement, which is conventionally set at about 200 msec. • - Kieras and Meyer suggested an alternative model in which as many as three items are processed in each gaze. • - Either of these models would predict no effect of distractor similarity on search time. • → ACT-R Model would predict : easier to find a number in a menu of letters than in a menu of numbers
4. Application to menu-selection data - cont’d - Our study • A within-subject menu-search task : selecting either a capital letter or a digit (background of letters or digits) • - Figure 8 presents the results from subjects for menus of nine elements, as in Nilsen (1991). • - As predicted by ACT-R, subjects are significantly faster, F(1,20) = 104.77, p < 0.01, • when the distractors are different than the target. • - There is one unexpected result in the data • : subjects slower (41 msec) in the presence of a letter background.
4. Application to menu-selection data - cont’d - Our study • Serial Position × Target × Background interaction • - Target × Position : F(8,160) = 6.49, p < 0.001 • - Background × Position : F(8, 160) = 4.30, p < 0.001 • - Target ×Background × Position : F(8,168) = 2.18, p < 0.05 • There are significant differences among the slopes • 1. number-on-number condition : 103 msec (slope) and 0.53 (Probability of feature overlap) • 2. number-on-letter condition : 84 msec and 0.39 • 3. letter-on-number condition : 80 msec and 0.42 • 4. letter-on-letter condition : 82 msec and 0.43 • → less ability to use feature to guide search in number-on-number condition.
4. Application to menu-selection data - cont’d - Our study • Figure 9 plots the predictions of the ACT-R theory for number and letter targets holding constant the • background as numbers. • - For number targets • : 186 × 0.53 = 99 msec • (actual slope = 103) • - For letter targets • : 186 × 0.42 = 78 msec • (actual slope = 80) • - Target ×Background interaction • (Fail in EPIC)
5. Conclusion • Here our goal has been to show that we properly model the basic processes of visual attention and that • they matter in a traditional HCI task such as menu scanning • A critical value was the approximately 185 msec involved in shifting attention to an item in a visual array. • However, if this value is simplisticly applied to a task, one can overestimate the time to shift attention • because attention has the capacity to focus on items with specific features, and one needs to consider • the implication of this focus for search time. • - For instance, Figure 9 shows that differential focus will result in differential search speed. • ACT-R provides an architecture in which to work out these complex interactions with visual attention • for both simple and complex task.