Download
1 / 9
90 likes | 226 Views
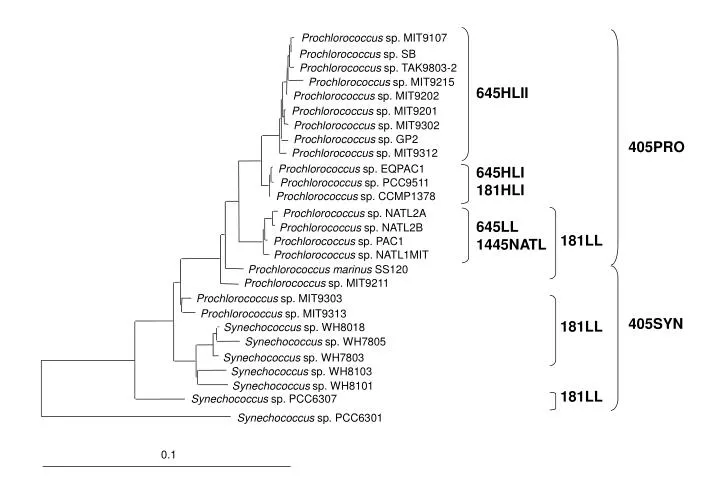
Prochlorococcus sp. MIT9107. Prochlorococcus sp. SB. Prochlorococcus sp. TAK9803-2. Prochlorococcus sp. MIT9215. 645HLII. Prochlorococcus sp. MIT9202. Prochlorococcus sp. MIT9201. Prochlorococcus sp. MIT9302. Prochlorococcus sp. GP2. 405PRO. Prochlorococcus sp. MIT9312. 645HLI

E N D
Prochlorococcus sp. MIT9107 Prochlorococcus sp. SB Prochlorococcus sp. TAK9803-2 Prochlorococcus sp. MIT9215 645HLII Prochlorococcus sp. MIT9202 Prochlorococcus sp. MIT9201 Prochlorococcus sp. MIT9302 Prochlorococcus sp. GP2 405PRO Prochlorococcus sp. MIT9312 645HLI 181HLI Prochlorococcus sp. EQPAC1 Prochlorococcus sp. PCC9511 Prochlorococcus sp. CCMP1378 Prochlorococcus sp. NATL2A 645LL 1445NATL Prochlorococcus sp. NATL2B 181LL Prochlorococcus sp. PAC1 Prochlorococcus sp. NATL1MIT Prochlorococcus marinus SS120 Prochlorococcus sp. MIT9211 Prochlorococcus sp. MIT9303 Prochlorococcus sp. MIT9313 405SYN 181LL Synechococcus sp. WH8018 Synechococcus sp. WH7805 Synechococcus sp. WH7803 Synechococcus sp. WH8103 Synechococcus sp. WH8101 181LL Synechococcus sp. PCC6307 Synechococcus sp. PCC6301 0.1
FISH analysis of natural Prochlorococcus populations I • North-east Atlantic • positive signals with HLI and LL Depth Proportion of DAPI-stained cells giving (m) a signal with each probe (%) 645HLI 181LL CYA664 3 22 <1 23 40 20 <1 23 80 0 13 14
FISH analysis of natural Prochlorococcus populations II • Red Sea • positive signals with HLII and LL Depth Proportion of DAPI-stained cells giving (m) a signal with each probe (%) 645HLII 181LL 1445NATL 405PRO 405SYN CYA664 10 11.8 0.2 0.1 15.8 0.2 16.8 50 8.1 0.1 0.1 18.5 0.7 17.0 100 9.9 2.0 2.0 15.8 0.2 17.1
16.2.99 8.3.99 18.3.99 19.4.99 27.4.99
11.5.99 14.6.99 18.7.99 23.8.99 7.9.99
Comparison of physiological properties of Prochlorococcus strains MED4 (HLI) TAK9803 (HLII) SS120 (LL) chlb2/a2 ratio low (0.05 -0.15) lowhigh (0.4 -2.4) optimal growth irradiance15-80* ? 8-30 ** major antenna apoproteins ~ 32.5 kDa ~33kDa28-34 kDa copies of pcb gene single single multiple (7) phycoerythrin absent absentpresent P inducible protein present absent absent growth on nitrate no ? no * photoinhibited only around 450 mol photons m-2 s-1 ** photinhibited at light intensities greater than 37 mol photons m-2 s-1 N.B. MED and SS120 genomes appear to be co-linear; 16S rDNA identity = 98.3%