Download
1 / 26
260 likes | 346 Views
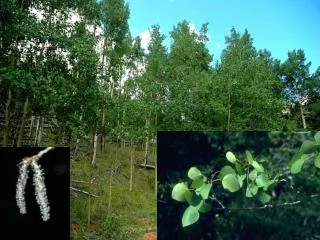
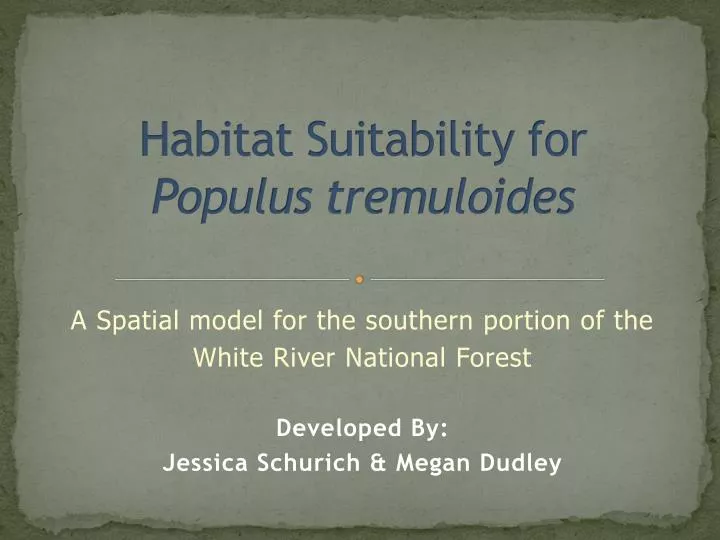
Habitat Suitability for Populus tremuloides. A Spatial model for the southern portion of the White River National Forest Developed By: Jessica Schurich & Megan Dudley. Scope of Project & Funding. Use field collected data to determine factors that contribute to aspen decline

E N D
Habitat Suitability for Populustremuloides A Spatial model for the southern portion of the White River National Forest Developed By: Jessica Schurich & Megan Dudley
Scope of Project & Funding • Use field collected data to determine factors that contribute to aspen decline • Grant is funded through U. S. Forest Service, R2 Forest Health Protection • Useful to Forest Health Managers, Population Ecologists & Outdoor Enthusiasts
Significant Studies Monitoring Aspen • Worrall, Egeland, Sheppard, and Mask (2008) Aspen dying quickly (3-4 years) throughout the Gunnison, Grand Mesa, Uncompahgre, and San Juan National Forests Termed SAD (Sudden Aspen Decline) South, West-facing aspects often with higher mortality Regeneration was also low in affected stands • Hogg, et al. (2008) Aspen stands in west-central Canada experienced dieback following 2001-2002 drought
Model Development • Create a spatial model for aspen habitat suitability Of the five study areas selected the WRNF Input significant spatial parameters • Testthe model Validate the model using aerial survey & remotely-sensed vegetation datasets
Datasets Used in the Spatial Model • PRISM Climate Group (Raster) June-September, 1999-2010 Maximum Daily Temperature Monthly Precipitation • Soil Survey Data (Vector) White River National Forest • Digital Elevation Model (Raster) 1/3 arc second (10 m resolution) U.S.G.S. National Seamless Server • Stand Survey Data (Vector) M. Dudley; 2009-2010
PRISM Data • Data downloaded as nation-wide compressed .gz files • Renamed to ASCII (.asc) format • Clipped to Colorado • Defined Projection • Averaged by month across years • Calculated and sum yearly differences • Reclassified into 5 categories, based on Natural Breaks
Soil Survey Data • Data downloaded from White River National Forest website Note: Only southern portion available • Conversion from shape file to raster for processing & analysis • Create non-spatial table with soil & site info • Joined to soils layer
Digital Elevation Model • Downloaded from the U.S.G.S National Elevation Dataset (NED) • Use of mosaic tool for separate DEMs • Generated single DEM • Derived aspect & reclassify into north, south & east, west • Reclassified elevation into areas >/< 3000 m
Testing withAerial Survey Data Testing withRemotely-Sensed Data
Suitability Model vs. Aerial Survey Data: Calculated the proportion of cells (pixels) in the study area which intersected aerial survey polygons to assess model accuracy
Suitability Model vs. Vegetation Cover Calculated the proportion of cells (pixels) in the study area which intersected remotely sensed polygons to assess accuracy
Results and Conclusions • Environmental factors that influence stand health • Elevation, aspect, soil type, maximum daily temp, precip • Others: • Snow depth • Stand age • Past insect/disease outbreaks • Model accuracy • Vs. Aerial survey: good agreement • Vs. Aspen covertype data*: not great • Model Improvements for future projects • Include more data layers (snow cover, stand age, etc.) • Consider using weather data for different time periods • i.e., develop models to compare 10- or 12- year averages with 30-year average