Download
1 / 14
140 likes | 254 Views
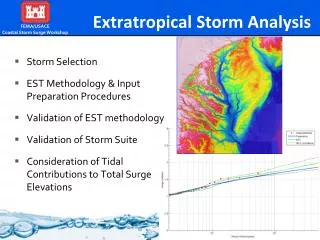
First global view of the Extratropical Tropopause Transition Layer (ExTL) from the ACE-FTS. UTLS workshop Boulder 2009. Michaela I. Hegglin, University of Toronto, CA Chris Boone, University of Waterloo, CA Gloria Manney, JPL, Pasadena, US

E N D
First global view of the Extratropical Tropopause Transition Layer (ExTL) from the ACE-FTS UTLS workshop Boulder 2009 Michaela I. Hegglin, University of Toronto, CA Chris Boone, University of Waterloo, CA Gloria Manney, JPL, Pasadena, US Kaley Walker, University of Toronto, CA
THE ACE-FTS • Atmospheric Chemistry Experiment Fourier Transform Spectrometer • Is a solar occultation instrument on Canada’s SCISAT-1 satellite => high S/N. • Provides accurate measurements of a number of species throughout the stratosphere and mesosphere since February 2004. • Provides a seasonally varying coverage of the globe, with an emphasis on NH midlatitudes and the polar region => modest global coverage. Latitude scanning (left) and retrieval locations (right) between Jan 2004 and Jun 2006. Hegglin and Shepherd, JGR 2007
Oversampling compensates for the satellite’s viewing geometry which smears the vertical information over 3 km. This yields better vertical information than usually expected from satellites. Probability density function of the vertical spacing between two ACE-FTS measurements as a function of altitude. Approximately 1 km vertical resolution is achieved in the ExTL Hegglin et al., ACP 2008
Validation of satellite measurements in the UTLS is not trivial. Tracer-tracer correlations reduce geophysical variability and provide a tool for the validation of satellites using non-coincident aircraft measurements. This comparison shows the high precision and vertical resolution of the ACE-FTS data. Hegglin et al., ACP 2008
Tropopause coordinates can also be used for satellite validation using non-coincident measurements. (SPURT H2O data courtesy of Cornelius Schiller, Research Center Juelich, Germany) SPURT (2001-2003) ACE-FTS (2004-2006) The comparison once again demonstrates the high accuracy of the ACE-FTS measurements.
Zonal mean cross sections of ACE-FTS tracers in tropopause coordinates indicate the existence of the ExTL on a global scale. CO MAM H2O MAM Hegglin et al., JGR 2009 • Strong gradients are observed in the horizontal as well as in the vertical. • Differences in the distributions of CO and H2O result from dehydration.
The relative vertical H2O gradients and the static stability structure of the tropopause region show similar seasonal behaviour and vertical scales. Relative vertical H2O gradients for ACE in DJF and JJA in tropopause coordinates. Climatological latitude-height cross sections of N2 from GPS data by Randel et al. (JGR 2007). Hegglin et al., JGR 2009 The comparison provides experimental evidence for the hypothesis that H2O plays a radiative role in forcing and maintaining the structure of the TIL as suggested by Randel et al. [2007].
ACE-FTS tracer and GPS temperature climatologies (here vertical profiles in tropopause coordinates) can be used to quantify the chemical and dynamical structure of the tropopause region. Mean profiles of CO and O3 gradients, and temperature in tropopause coordinates. H2O, CO, O3, and N2 mean profiles in tropopause coordinates. Hegglin et al., JGR 2009 The absolute maximum in the CO gradient is found at the thermal tropopause, indicating that it represents a local minimum in vertical mixing.
The ACE-FTS yields first insight into tropical and tracer-tracer correlations in the Southern hemisphere. These – besides removing geophysical variability – reveal different transport regimes. Polar vortex air with lower H2O and O3 values. The theoretical ‘L’-shape is observed in the tropics. Seasonal dependency of the stratospheric entrance value of H2O.
Two-dimensional probability density functions (PDFs) reveal mixing characteristics [e.g. Hegglin&Shepherd, 2007]. Hegglin et al., JGR 2009 The minimum in the PDF indicates a minimum in mixingapproximately located at the thermal tropopause.
The ExTL depth is derived empirically for 10° latitude bins using the correlation method of Pan et al. [2004, 2007] applied to CO-O3 and H2O-O3. Note, a log-scale is used for H2O! ExTL Top ExTL Bottom fit Hegglin et al., JGR 2009 Ultimately, the method and model used to derive the tropopause heights for the ACE-FTS measurements will determine the accuracy of this method to derive the thickness of the ExTL.
The ACE-FTS gives insight into inter-hemispheric, latitudinal, and seasonal differences in ExTL depth. Upper and lower boundary of the ExTL as distance from the thermal tropopause derived from ACE-FTS H2O-O3 and CO-O3 correlations. Hegglin et al., JGR 2009 • The ExTL in the Southern Hemisphere is thinner by ~1 km. • The ExTL depth increases with latitude. • The ExTL depth varies when using different tracer-pairs.
CONCLUSIONS • The ACE-FTS has been shown to offer unprecedented accuracy and vertical resolution for a satellite instrument and hence provides a valuable data set for the study of the tropopause region. • The ACE-FTS provides new global information on the extra-tropical tropopause transition layer (ExTL). • The ACE-FTS can therefore be used test the robustness and representativeness of results derived from geographically limited aircraft measurements. • New value can be gained from existing aircraft data as providing non-coincident validation of new satellite data. Hegglin et al., ACP 2008: ‘Validation of ACE-FTS satellite data in the upper troposphere/lower stratosphere (UTLS) using non-coincident measurements’ Hegglin, M. I., C. D. Boone, G. L. Manney, and K. A. Walker, JGR 2009: ‘A global view of the extratropical tropopause transition layer from Atmospheric Chemistry Experiment Fourier Transform Spectrometer O3, H2O, and CO’
While vertical smearing introduces an error of about 10%, horizontal smearing is unlikely to be an issue for LS measurements down to the tropopause. However, UT measurements might be biased low. Hegglin et al., JGR 2009