Download
1 / 29
290 likes | 399 Views
How are Highway Designs Actually Represented in Surface Models for Automated Machine Guidance and How Should We Control Them? Alan Vonderohe Construction and Materials Support Center University of Wisconsin – Madison August 21, 2012. Smooth Curves vs. Triangulated Irregular Networks (TINs).

E N D
How are Highway Designs Actually Represented in Surface Models for Automated Machine Guidance and How Should We Control Them?Alan VonderoheConstruction and Materials Support CenterUniversity of Wisconsin – MadisonAugust 21, 2012
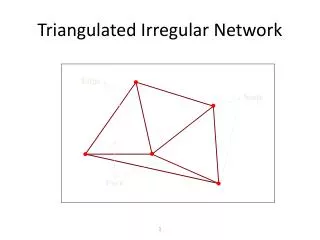
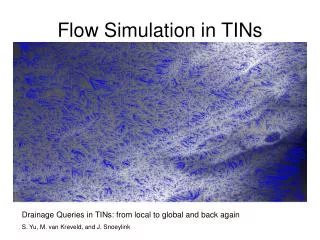
Smooth Curves vs. Triangulated Irregular Networks (TINs) • Geometric highway design objects consist of mathematically-continuous curves and lines described by equations. • Surface models (TINs), in design software and used for construction by AMG, consist of discrete points connected by straight-line segments that become edges of triangles. • There are no second-order curves. • The only things described by equations are the triangles.
Model DevelopmentIssue • Short line segments: • More accurate representation; larger file sizes; greater compute times; greater data transfer times; more data management issues. • Long line segments: • Decreased data management issues but increased risk of under-representation of design. • Optimum line segment length (data frequency / data density): • Maximum length that yields threshold tolerable error.
Curve; Line Segment; and Errors () • How to maximize d while holding to a pre-determined tolerance? • Derive relationships among d, , curve parameters, and design speed using geometry, physics, quantifiable human factors, and existing AASHTO standards.
Circular Horizontal Curves Chord length: Curve length (station difference): Minimized when R is minimized: Function of design speed (V):
Parabolic Crest Vertical Curves Reaction time and braking time: AASHTO values yield function of design speed (V): Station difference by curve length: Minimized when L is minimized: Depends on stopping sight distance and heights of eye and object.
Parabolic Sag Vertical Curves Station difference by curve length: Depends on stopping sight distance and characteristics of headlights: Minimized when L is minimized: Reaction time and braking time: AASHTO values yield function of design speed (V):
2011 Pilot Project Data Frequency Standard • Tolerable errors selected according to sub grade and base course staking tolerances for construction checks from WisDOT’s Standard Specifications. • Ensures that surface models represent geometric design objects to accuracy used for construction acceptance. • Generated tables of minimum data frequencies for various design speeds. • Tables aggregated into ranges of design speed supported by 10, 25, and 50 ft data frequencies. • Ensures data points at full and half stations, corresponding with cross-sections on plans.
No issues with data frequency reported on four 2011 pilot projects.
Utility of Data Frequency Functions • Two possible implementation approaches: 1. A priori standards for corridors, projects, or project components, based upon design speeds. - Ensures all curves are adequately (and consistently) represented but there will be more data than required. 2. A posteriori software function computes required data frequency for each design object based upon its own characteristics. - Data frequencies will vary (and be optimal) along an alignment. • Parametric forms of developed functions can be used even if AASHTO standards for parameter values change.
Construction-Side Findings from Four 2011 Data Sharing and HMA Base Course Pilot ProjectsAlan VonderoheConstruction and Materials Support CenterUniversity of Wisconsin – MadisonAugust 21, 2012
USH 10 Re-Alignment, Bi-Directional to Divided Capacity Expansion.
2011 Pilot Project Goals • Determine benefits of providing 3D roadway models at pre-bid. • Determine utility of 3D models for bid preparation. • Establish requirements for “construction–ready” 3D models flowing from design process. • Field test “construction readiness” of 3D models. • Evaluate AMG QA/QC specification components for HMA base course.
2011 Pilot Project Methods • Interviewed all parties requesting pre-bid packages to determine pre-bid uses. • Follow-up interviews with winning contractors and sub-contractors to determine post-bid office and field construction uses. • Interviewed WisDOT design engineers, construction engineers, and supervisors. • Site visits to all projects. • Return site visits to two projects.
Contractors’ Pre-Bid Use and Benefits of AMG Roadway Models • All nine parties requesting models were able to import data. • Pre-bid availability frees contractor personnel for preparation of more bids…hence, more competition. • Better conveyance of design intent reduces risk-taking in bidding. • Earlier and more effective identification of cost-reduction incentives.
Contractors’ Pre-Bid Use and Benefits of AMG Roadway Models • Inspection and checking of models, against plans and for constructability, enhanced by 3D visualization.
Contractor Pre-Bid Use of Models • Utility of existing surface is extensive. • Visualization of surrounding area – beyond ROW. • Reduces uncertainty in project planning. • Can identify candidate areas for borrow and waste and compute volumes. • Eliminates need for preliminary site survey.
Post-Award and Construction Use and Needs of AMG Roadway Models • Linear features (e.g., edge of pavement, shoulder breaks, ditch flow lines) needed for construction operations. • Serve as break lines in models but need separate identification. • Provide all AMG surfaces (e.g., top of select crushed material).
Construction Activities • All earthwork and some HMA base course by AMG. • Prime contractor, subs, and project engineer use same control for site calibration. • Very little staking. • Slope stakes, string lines for concrete base course and for paving.
Construction Activities HMA Base Course Fine Grading First Pass Last Pass Finished Surface
Construction Activities HMA base course finished surface checks against plan elevations (ft): Station LeftCenter Right 152+50 16’lt (-.03) 0’ (-.04) 16’rt (-.02) 158+00 16’lt (+.02) 0’ (+.05) 16’rt (+.04) 12+50 12’lt (-.06) 0’ (-.03) 12’rt (-.03) 16+00 12’lt (+.01) 0’ (+.03) 12’rt (+.04) • Meets specification but sample is small.
Other Construction Benefits • One model for all AMG operations – all players on same page. • Fewer design revisions during construction – fewer delays. • Engineer can check construction work at will – fewer delays. • Data flows begin to lower barriers between design and construction.
Other Findings from 2011 Pilots • Well-configured, corridor-consistent geodetic control is essential. • WisCORS (real-time network) used extensively for rovers and beginning to be used on machines (potential for elimination of local base station).