Download
1 / 10
100 likes | 276 Views
TECO-2012 (Brussels,Belgium,17 Oct. 2012). 3 ( 5 ). Field experiment on the effects of a nearby asphalt road on temperature measurement. N. S. wind. Summer. Meteorological Instruments Center, Japan Meteorological Agency (JMA).

E N D
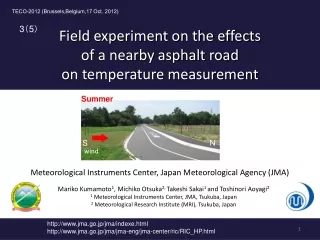
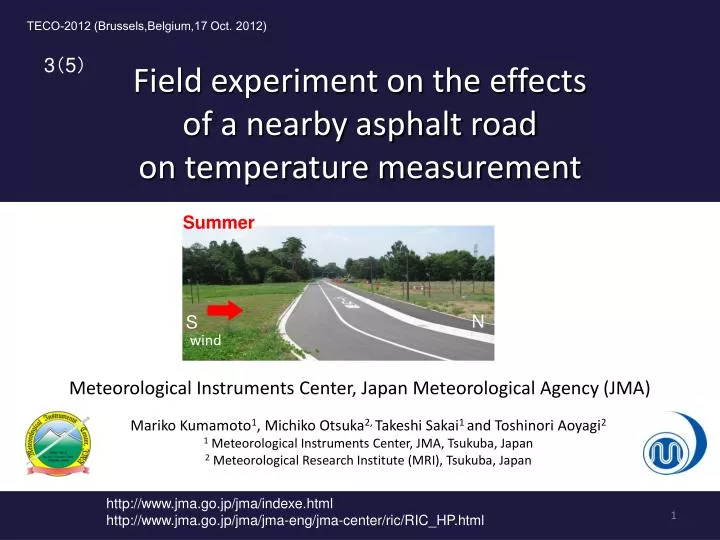
TECO-2012 (Brussels,Belgium,17 Oct. 2012) 3(5) Field experiment on the effects of a nearby asphalt road on temperature measurement N S wind Summer Meteorological Instruments Center, Japan Meteorological Agency (JMA) Mariko Kumamoto1, Michiko Otsuka2, Takeshi Sakai1 and Toshinori Aoyagi2 1 Meteorological Instruments Center, JMA, Tsukuba, Japan 2 Meteorological Research Institute (MRI), Tsukuba, Japan http://www.jma.go.jp/jma/indexe.html http://www.jma.go.jp/jma/jma-eng/jma-center/ric/RIC_HP.html
0.Background Needs for observing temperature data of high quality from data users Many JMA stations are located in urbanized areas and surrounded by artificial heat source (buildings, car roads, car parks, artificial surfaces … ).. • Metadata describing site environment would be helpful. • e.g. the WMO siting classification (CIMO Guide) However, interpretation of such metadata is unclear without any theory or guidelines based on related experiment or research.
1.Purpose of Study • Focus on the effects from asphalt surface on temperature measurement • Clarify the characteristics of temperature distributionnear an asphalt car road • With relation to the distance from the road, wind condition and mounting height of sensors • Better interpretation of siting metadata to estimate temperature measurement uncertainty WIND T1T2T3 T4 Heated Air Tref Glass Glass Asphalt road
□: Experiment Site (square 100m) as area below indicates ●: Thermometers with radiation shield :Asphalt Road 2.Dataand method 2-1.Field layout and sensor installations Distances from the road (m) Summer : 30th June- 1st Oct. 2010, Winter:29th Nov. 2010 - 6th Jan. 2011 10.0m Sample points T4 T3 T2 T1 6.9m 3.2m 2.5m Difference(℃) δT = TN – T0 (compared at the same height) The height of temperature measurement is 1.5m on JMA operational observation. 0.8m 1.5m 10.0m 0.5m (Image:Google Maps) Reference point T0 height TN (N=1,2,3,4) T0 Prevailing wind direction Summer: S (SSW-ESE) 10.0m Screen with artificial ventilation ( Thermometer ) Ultrasonic anemometer 2m Surface temperature (Asphalt road, glass) In winter, the prevailing wind direction was NW (WNW-NE), so the sensors were installed on the opposite side.
2-2. WMO siting classification and sampling points ●Temperature by the WMO siting classification (2010) (surface of heat sources[%]) class3class2class1 class5class4 up to 1℃ up to 2℃ Uncertainty up to 5℃ ・not meeting the requirement of Class4 ・less than 50 % circular area of 10m ・ less than 30 % circular area of 3m 100m circle 30m circle 10m circle 10m class5class4class3 class3 Class 3, 4, and 5 are determined by the environment within 10m in radius. 0.8m3.2m6.9m10.0m circle 10m in radius S [%] 45% 30% 10% 0% ● The distances from the road and S [%] at each sampling point (the ratio of the area occupied by the road within 10m in radius) T1 T2 T3 T4 The distance from the road for each sampling point was determined to represent the conditions of Class 3, 4 and 5 in the WMO siting classification.
3.Results 3 - 1. Wind direction frequency and δT distribution at different distances / heights Summer distances (30th June- 1st Oct. 2010) Frequency×103 2.5m heights 1.5m Frequency×103 0.5m Frequency×103 δT(℃) (℃) (℃) (℃) class5class4class3 class3 • At 0.5m height in case of southerly wind, the highest frequency of biases were up to +0.2 to +0.4 ℃ • At 1.5m height , only small biases were seen near the road. No significant biases at T2, T3 and T4. T10.8 m T23.2 m T36.9m T410.0m
3-2. By wind speed δT frequency distributions (Surface temperature difference ≧ 10 °C) Summer (30thJune- 1st Oct. 2010) Southerly Frequency ratio ×0.01[%] distances 2.5m Wind speed [m/s] heights +0.1℃ +0.2℃ 1.5m [m/s] 0.5m [m/s] +0.3℃ +0.5℃ δT(℃) (℃) (℃) (℃) class5class4class3 class3 • In all cases, the stronger the wind, the fewer large biases • At 0.5mheight,the highest frequency of δTs and the range of δTs variation were larger • when the wind was less than 2m/s. • At 1.5m height, even when the wind speed was relatively weak, the highest frequency of • δTsappeared around0.0℃to +0.2℃regardless of the distance from the road. T10.8 m T23.2 m T36.9m T410.0m
4.Summary • The extent of effects of the asphalt road (10m in width) • At the height of1.5 m, the high frequency of δTs for the total period was around +0.1 – +0.2℃ and 0.0 ℃ , for summer and for winter respectively. • At the height of0.5 m, the effect depends significantly on the distance from the road. Not much difference at the height of 1.5 m. • When the wind speed is over2 m/s in summer or over1 m/s in winter, the effect is reduced. We presented only summer cases. If you would like to know winter cases or much more in details, please read papers.
5. Conclusion よとh From the results of the field experiment, • The effects of the road depend much on prevailing wind directions. • were reduced when the wind was relatively strong. • In the implementation of the WMO siting classification, • we also need to take wind conditions into account. How effect by the windward side? Surrounding objects such as buildings or trees may reduce the wind speed and affect temperature measurement. (Image:Google Maps) As a next step, we study the effects of nearby trees on the wind speed and temperature measurement by field experiment. 040m
● Another Experiment (currently in progress ) -Influences by the trees around the observation field- Fig. Layout of instrumentation • To support reliable high-quality climate monitoring, it is necessary to consider how environmental changes around the site influence observation data. • The examination is performed to allow quantitative evaluation for the effects of trees located at one side of the field on temperature and wind measurement data.