Download
1 / 12
140 likes | 335 Views
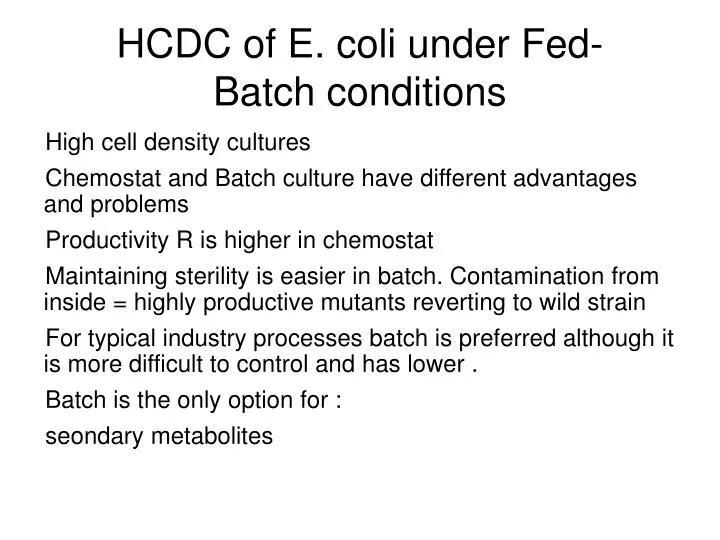
HCDC of E. coli under Fed- Batch conditions. High cell density cultures Chemostat and Batch culture have different advantages and problems Productivity R is higher in chemostat

E N D
HCDC of E. coli under Fed-Batch conditions High cell density cultures Chemostat and Batch culture have different advantages and problems Productivity R is higher in chemostat Maintaining sterility is easier in batch. Contamination from inside = highly productive mutants reverting to wild strain For typical industry processes batch is preferred although it is more difficult to control and has lower . Batch is the only option for : seondary metabolites
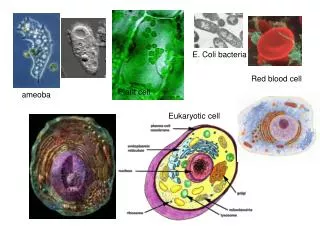
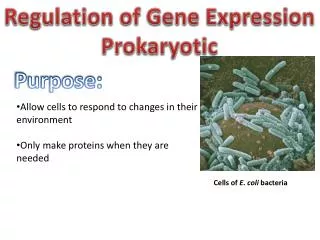
What is HCDC High Cell density Cultures are essential for maximum productivity of recombinant protein production (e.g. pharmaceuticals) After producing the biomass to the highest possible density (e.g. OD 50) the expression of the recombinant product (e.g. on mulitple plasmid copies) is induced. To produce OD 50 (about 50 g/L of dry mass) more than 100 g of substrate (e.g. sugar) is needed. Substrate inhibition (almost “jam”).
What is HCDC High Cell density Cultures are essential for maximum productivity of recombinant protein production (e.g. pharmaceuticals) After producing the biomass to the highest possible density (e.g. OD 50) the expression of the recombinant product (e.g. on mulitple plasmid copies) is induced. To produce OD 50 (about 50 g/L of dry mass) more than 100 g of substrate (e.g. sugar) is needed. Substrate inhibition (jam).
Why Fed-batch for HCDC? To add the full amount of substrate needed at the beginning substrate inhibition Solution: After an initial batch with less substrate, add substrate sequentially (Fed batch) Initial Batch The fedbatch has no outflow Feed is added from a concentrate (syrup) Arrows show S-addition Fed-batch S Time
Need for precise feed addition Too little glucose addition slows down the process too much Too high glucose concentrations build up acetate even at high DO concentrations when sugars are saturating Initial Batch Acetate buildup interferes with growth and expression of recombinant proteins Glucose should be administered on demand (avoid over saturation and strong substrate limitation) Controlled sugar addit. S Time
Why does acetate build up? 246 TCA Glycolysis faster than TCA / ETC / OUR Hence acetate (82) builds up. Metabolic overflow Crabtree effect. TCA bottleneck 103 20 20 103 01 01 20 82 20 82 8*20 ETC, OUR Abbreviations: TCA- Tricarboxylic Acid Cycle. OUR = oxygen uptake rate, ETC = Electron Transport Chain, 24-6 = glucose, 10-3= pyruvate
Strategies to administer glucose on demand Administering On demand requires feedback loop (measuring glucose demand – then increasing or decreasing glucose flowrate to reactor). No demand if glucose is saturating. Strategy 1: Glucose stat: measure glucose and only increase feedrate when glucose is less than saturating levels. Problems: No online glucose sensor, need for very precise measurements at very low (close to ks value of E.coli) Strategy2: Acetate stat: measure acetate online and lower glucose feedrate as soon as acetate builds up. Problem: No online acetate sensor Strategy 3: Monitor glucose saturation from changes in OUR in response to feedrate changes. (“Starvostat”) BTW. E.coli can take up acetate when no glucose, but DO is present.
How to determine glucose demand of the culture Experience from our lab class (OUR) shows that a starving culture responds to the addition of substrate by increasing OUR. If there is not effect by adding extra substrate culture was S-saturated.
Monitor glucose demand of the culture Keep DO steady state by constant glucose feed rate Do a step increase in feedrate No decrease in DO (hence no increase in OUR) go back to old feedrate, as culture is feed saturated (no demand) Sign of demand Decrease in DO culture was limited shows a higher capacity for OUR, ETC and TCA and demands more glucose without risk of acetate buildup D.O. S Glucose feedrate Time
D.O. S Glucose feedrate Time Feedback control to keep culture on the border of substrate saturation Keep testing for glucose demand. If the culture shows glucose demand, increase the feedrate by say 2% and keep testing for further glucose demand. As long as the culture will grow, its demand will increase Problem with this approach: If culture is saturated the glucose step increase acetate buildup. Better approach?
Method published by V. Whiffin et al. Measure OUR-1 Interrupt feed for 30 sec. Measure OUR-2 If OUR-2 < OUR-1,(=starving) then increase FR by 1 %, else decrease FR by 1% Keep new FR for 2 min Resume from the top
Feedback control to keep culture on the border of substrate saturation Keep testing for glucose demand. If the culture shows glucose demand, increase the feedrate by say 2% and keep testing for further glucose demand. As long as the culture will grow, its demand will increase Problem with this approach: If culture is saturated the glucose step increase acetate buildup. Better approach? OUR S Glucose feedrate Time