Download

1 / 44
440 likes | 533 Views
Visualizing Knowledge Structure of an Academic Field. 世新大學資訊傳播學系 林頌堅 scl@cc.shu.edu.tw. Research Problems. The rapid growth of papers. Retrieving EBSCOhost DB by the query: “social network” or “social networks”. Retrieving ACM DL by the query: “information visualization”.

E N D
VisualizingKnowledge Structureof an Academic Field 世新大學資訊傳播學系 林頌堅 scl@cc.shu.edu.tw
The rapid growth of papers Retrieving EBSCOhost DB by the query: “social network” or “social networks”
Retrieving ACM DL by the query: “information visualization”
For many academic fields , it is more difficult to analyze and understand their knowledge structures than before.
Knowledge structure in an academic field • Important research topics (taking the field of information visualization as an example) • interaction, evaluation, user study, interface, visual analytics, focus+context, overall+detail, trees, maps, networks, …… • Relations between research topics • eg. user interface evaluation interaction visual analytics ……
Paper contents present the research topics of studies In this paper we present an approach that integrates interactive visualizations in the exploratory search process. In this model visualizations can act as hubs where large amounts of information are made accessible in easy user interfaces. Through interaction techniques this information can be combined with related information on the World Wide Web. We applied the new search concept to the domain of stock market information and conducted a user study. Participants could use this interface without instructions, could complete complex tasks like identifying related information items, link heterogeneous information types and use different interaction techniques to access related information more easily. In this way, users could quickly acquire knowledge in an unfamiliar domain.
When scientists decide to write a paper, one of the first things they do is identify an interesting subset of the many possible topics of scientific investigation. The topics addressed by a paper are also one of the first pieces of information a person tries to extract when reading a scientific abstract.
Contents of papers show knowledge structure • The topics about a paper are presented in its content • Papers with similar contents are relevant to some topics in common • For a certain topic, the number of relevant papers may indicate its importance • If there were a relation between two different topics, they may be presented ina same set of papers
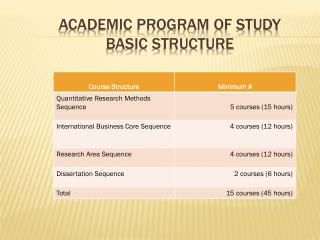
Papers as source to extract knowledge structure of an academic field 1. Collecting papers published in the academic field 2. Establishing feature vectors for representing the papers 3. Estimating relation between any pair of the papers 4. Presenting the relations with proper data structure for visualizing knowledge structure of the field
Data structure to present knowledge structure for visualization • Trees • Scatter plots • Networks • 2-dimenational maps
Network representation for knowledge structure of an academic domain • Vertices • Papers published in the field • Edges • Relations between the papers • Determined by their relevance scores
Features of network representation • Intuitive presentation • Ease for visual navigation and search • Applying developed network analysis technologies
Problems of network visualization • Observing the overview and the details of a large and dense network simultaneously is very difficult • Process of identifying topics by visual analysis and naming them is usually very arbitrary
Ideas to solving problems • Deleting redundant edges to reduce network complexity • Grouping highly-related nodes based on characteristics of network structure • Labeling node groups according to contents of the corresponding papers
The process of visualizing knowledge structure of a domain Term Extraction Relevance Estimation Network Establishment PFNet Scaling Network Partitioning Graph Drawing Topic Labeling
Term extraction • Terms are extracted from papers to be used as representing features • In Chinese text, boundaries of words are not clear • Term extraction should consider the unithood and termhood(Kageuraand Umino, 1996) • Unithood: the degree of strength or stability of syntagmatic combinations and collocations • Termhood: the degree that a linguistic unit is related to domain-specific concepts • Automatic Chinese term extraction using statistical information of occurrences of character strings
Term extraction • A feature vector is assigned to each paper based on occurrence frequency of the extracted terms in the paper and the collection : the frequency count of the term occurring in the paper : the inverse document frequency of the term in the collection
Relevance estimation • To determine relevance score between any pair of papers based on the closeness of their feature vectors • Vector space model
Network Establishment • Each paper corresponds to a vertex in the network • The edge between a pair of vertices is determined by the relevance score of their corresponding papers • Edges with very small relevance score are deleted to reduce computational resources
PF-Net scaling • Pruning a amount of less salient edges to reduce network complexity • Retaining the structural characteristics of the original network • keeping those edges not violate the triangle inequality <+
PF-Net scaling • Generalizing triangle inequality by using the Minkowski distance
PF-Net scaling • Generalizing triangle inequality by extending to q intermediate vertices, ……
PF-Net scaling • The result of PF-Net Scaling is a family of Networks determined by the parameters q and r PF-Net(q, r) • The PF-Net(n − 1, ∞) includes all of the edges in any minimum spanning tree
Network partition • Papers related to the same topics have similar contents • The corresponding vertices may be close to each other on the established network • Partitioning networks into groups of highly inter-connected nodes • The resulting node groups are considered to be research topics Community Detection
Network partition • Partitioning networks into groups of highly inter-connected nodes • The nodes belonging to different groups are only sparsely connected • The quality of a possible partition is measured by it modularity • The fraction of all edges that lie within groups minus the expected value of the same quantity in a graph in which the vertices have the same degrees but edges are placed at random without regard for the groups
Network partition • Searching a network partition such that its modularity is maximum among all possible partitions • Divisive algorithms • Detecting inter-community links and removing them from the network • Agglomerative algorithms • Merging similar nodes/communities recursively • Optimization methods • Maximizing an objective function
Network partition • The Girvan and Newman’s algorithm was used in this study • Divisive algorithm • All partitions are generated by iteratively removing edges from the network • The remove of an edge is determined by it betweenness • The partition with the maximal modularity is output as the result
Graph drawing • Kamada-Kawai algorithm(1989) • A force-directed graph layout algorithm • Suitable for visualizing the result network of PFNet scaling
Topic labeling • The subgroups of nodes produced by the Girvan-Newman algorithm are considered to be important research topics • Selecting the terms with the five highest frequency count occurring in the content of the papers to correspond to node subgroups
An Experiment onthe Field of Information Communication in Taiwan
Experimental data • Data source: master theses published by related graduate schools • retrieved from the database of the National Digital Library of Theses and Dissertation in Taiwan • Total 778 theses
Extracted terms • 293 terms were extracted from titles and abstracts of the collected theses • 1 thesis without any extracted term was excluded in the following experiment • 777 feature vectors
Established network • 777 nodes for the examined theses • 7168 edgeswith relevance score > 0.1 • Network density =
The result of PF-Net scaling Insignificant edges were deleted 7168 edges 768 edges Network structure emerges
The result of community detection 30 subgroups with the condition of maximal modularity
Some examples of topics found • C4:線上遊戲、玩家、 online game 、論壇、女性 • C11: 風格、圖形、造形、藝術、平面 • C13: 故事、兒童、實境、閱讀、體驗 • C21: 圖書館、館員、館藏、社區、讀者 • C23: 圖像、檢索、雜訊、複製、影像品質 • C30: 報導、框架、形象、中國、編碼 • C17: 團體、家庭、電話、壓力、健康 • C27: 轉換、標籤、視覺化、演算法、投資
Conclusions • Integrating several technologies to visualize knowledge structure of an academic field • Automatic Chinese term extraction • Relevance estimation • PF-Net scaling • Community detection algorithm • Easily discovering important topics and their relations on the resulting network • Most of the labels of topics are related to the research problems and the methodologies in the examined field
Future works • Improvement of term extraction • Processing of interferences by less relevant papers to the fields • Interactive functions for visual analytics of academic fields • More evaluations