Download
1 / 23
240 likes | 443 Views
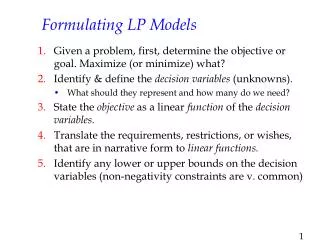
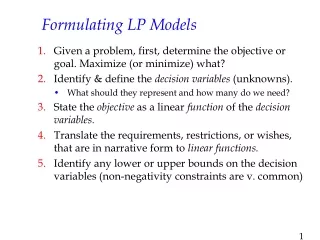
Lecture 4 Multi-period Planning Models Cash-Flow-Matching LP Project-funding example Summary and Preparation for next class. Multi-period Planning Models. In many settings we need to plan over a time horizon of many periods because

E N D
Lecture 4 • Multi-period Planning Models • Cash-Flow-Matching LP • Project-funding example • Summary and Preparation for next class
Multi-period Planning Models In many settings we need to plan over a time horizon of many periods because • decisions for the current planning period affect the future • requirements in the future need action now Examples include: • Production / inventory planning • Human resource staffing • Investment problems • Capacity expansion / plant location problems
National Steel Corporation • National Steel Corporation (NSC) produces a special-purpose steel used in the aircraft and aerospace industries. The sales department has received orders for the next four months: Jan Feb Mar Apr Demand (tons) 2300 2000 3100 3000 • NSC can meet demand by producing the steel, by drawing from its inventory, or a combination of these. Inventory at the beginning of January is zero. Production costs are expected to rise in Feb and Mar. Production and inventory costs are: Jan Feb Mar Apr Production cost 3000 3300 3600 3600 Inventory cost 250 250 250 250 • Production costs are in $ per ton. Inventory costs are in $ per ton per month. For example, 1 ton in inventory for 1 month costs $250; for 2 months, it costs $500. • NSC can produce at most 3000 tons of steel per month. What production plan meets demand at minimum cost?
NSC Production Model Overview • What needs to be decided? A production plan, i.e., the amount of steel to produce in each of the next 4 months. • What is the objective? Minimize the total production and inventory cost. These costs must be calculated from the decision variables. • What are the constraints? Demand must be met each month. Constraints to define inventory in each month. Production-capacity constraints. Non-negativity of the production and inventory quantities. • NSC optimization model in general terms: min Total Production plus Inventory Cost subject to: • Production-capacity constraints • Flow-balance constraints • Nonnegative production and inventory
NSC Multi-period Production Model • Index: Let i = 1, 2, 3, 4 represent the months Jan, Feb, Mar, and Apr, respectively. • Decision Variables: Let Pi = # of tons of steel to produce in month i Ii = # of tons of inventory from month i to i+1 Note: The production variables Pi are the main decision variables, because the inventory levels are determined once the production levels are set. Often the Pi s are called controllable decision variables and the Ii s are called uncontrollable decision variables. • Objective Function: The total cost is the sum of production and inventory cost. Total production cost, PROD , is: PROD = 3000 P1 + 3300 P2 + 3600 P3 + 3600 P4 . Total inventory cost, INV , is: INV = 250 I1 + 250 I2+ 250 I3 + 250 I4 .
Demand Constraints • In order to meet demand in the first month, we want P1 2300. Set I1 = P1 - 2300 and note that P1 2300 is equivalent to I1 0. • In order to meet demand in the second month, the tons of steel available must be at least 2000: I1 + P2 2000. Set I2 = I1 + P2 - 2000 and note that I1 + P2 2000 is equivalent to I2 0. • The inventory and non-negativity constraints: (Month 1) I1 = P1 - 2300, I1 0 (Month 2) I2 = I1 + P2- 2000, I2 0 (Month 3) I3 = I2 + P3 - 3100, I3 0 define the inventory decision variables and enforce the demand constraints.
NSC Production Model (continued) • Another way to view the constraints: The inventory variables link one period to the next. The inventory definition constraints can be visualized as “flow balance” constraints: P1 P2 P3 I0 = 0 I1 I2 I3 Month 1 Month 2 Month 3 2300 2000 3100 • Flow-balance constraints for each month Flow in = Flow out (Month 1) P1= I1 + 2300 (Month 2) I1 + P2= I2 + 2000 (Month 3) I2 + P3= I3 + 3100 .….. • Are there any other constraints? Production cannot exceed 3000 tons in any month: Pi 3000 for i = 1, 2, 3, 4.
NSC Linear Programming Model Min PROD + INV subject to: • Cost Definitions: (PROD Def. ) PROD = 3000 P1 + 3300 P2 + 3600 P3 + 3600 P4 . (INV Def.) INV = 250 I1 + 250 I2+ 250 I3 + 250 I4 . • Production-capacity constraints: Pi 3000, i = 1, 2, 3, 4. • Inventory-balance constraints: (Flow in = Flow out) (Month 1) P1 = I1 + 2300 (Month 2) I1 + P2 = I2 + 2000 (Month 3) I2 + P3 = I3 + 3100 (Month 4) I3 + P4 = I4 + 3000 • Nonnegativity: All variables 0
=SUMPRODUCT(D8:G8,D13:G13)/1000 =SUMPRODUCT(D9:G9,D15:G15)/1000 Objective Function =D3+D4 =+D12+D13-D14 NSC Optimized Spreadsheet • The optimal solution has a total cost of $35,340,000.
Jan Feb Mar Apr May Jan 1 2 3 4 5 T time Feb Mar Apr May Feb 1 2 3 4 5 T time Mar Apr May Mar 1 2 3 4 5 T time Multi-period Models in Practice • Most multi-period planning systems operate on a rolling-horizon basis: • A T-period model is solved in January and the optimal solution is used to determine the plan for January. In February, a new T-period model is solved, incorporating updated forecasts and other new information. The optimal solution is used to determine the plan for February. • Often long-horizon models are used to estimate needed capacity and determine aggregate planning decisions (strategic issues). Then more detailed short-horizon models are used to determine daily and weekly operating decisions (tactical issues).
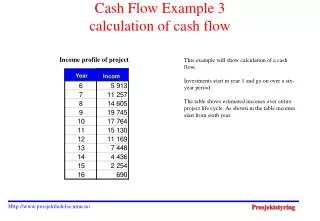
Project-Funding Problem • A company is planning a 3-year renovation of its facilities and would like to finance the project by buying bonds now (in 2001). A management study has estimated the following cash requirements for the project: Year 1 Year 2 Year 3 2002 2003 2004 Cash Requirements (in $ mil) 20 30 40 • The investment committee is considering four government bonds for possible purchase. The price and cash flows of the bonds (in $) are: Bond Cash Flows Bond 1 Bond 2 Bond 3 Bond 4 2001 -1.04 -1.00 -0.98 -0.92 2002 0.05 0.04 1.00 0.00 2003 0.05 1.04 1.00 2004 1.05 • What is the least expensive portfolio of bonds whose cash flows equal or exceed the requirements for the project?
Linear-Programming Formulation • Decision Variables: Let Xj = # of bond j to purchase today (in millions of bonds) • Objective function: Minimize the total cost of the bond portfolio (in $ million): min 1.04 X1 + 1.00 X2+ 0.98 X3+ 0.92 X4 . • Constraints: • In each year, the cash flow from the bonds should equal or exceed the project’s cash requirements: Cash flow from bonds Requirement • This leads to three constraints: (yr. 2002) 0.05 X1 + 0.04 X2 + X3 20 (yr. 2003) 0.05 X1 + 1.04 X2 + X4 30 (yr. 2004) 1.05 X1 40 • Finally, the nonnegativity constraints: Xj 0, j = 1, 2, 3, 4. • In this formulation, what happens to any excess cash in a given year?
Surplus-Cash Modification • Now suppose that any surplus cash from one year can be carried forward to the next year with 1% interest. How can the LP formulation be modified? • The surplus cash in year 2002 is: 0.05 X1 + 0.04 X2 + X3- 20 . Multiplying this amount by 1.01 and adding to the cash available in 2003 gives: 0.05 X1 + 1.04 X2+ X4 + 1.01(0.05 X1 + 0.04 X2 + X3 - 20) 30 . This can be simplified to 0.1005 X1 + 1.0804 X2 + 1.01 X3 + X4 50.2 . The surplus cash in 2003 is: 0.1005 X1 + 1.0804 X2 + 1.01 X3 + X4 - 50.2 . This amount could be multiplied by 1.01 and added to the cash available in 2004. • This is getting ugly . Is there a better way?
Surplus-Cash Modification (continued) • A better way is to define surpluscash variables: Ci= surplus cash in year i, in $ millions, where i = 1 (2002), 2 (2003), 3 (2004). • Constraints: • In each year, the cash-balance constraints can be written as: Cash in = Cash out or, in more detail, Cash from bonds + Surplus cash from previous year = Requirement + Cash for next year • This leads to three constraints: (yr. 2002) 0.05 X1 + 0.04 X2 + X3 = 20 + C1 (yr. 2003) 0.05 X1 + 1.04 X2 + X4+ 1.01 C1 = 30 + C2 (yr. 2004) 1.05 X1 + 1.01 C2 = 40 + C3 • And, as usual, we add the non-negativity constraints: Ci 0, i = 1, 2, 3.
1.01 C 1 1.01 C 2 Project-Funding Linear Program • The complete modified linear program is: min 1.04 X1+ 1.00 X2 + 0.98 X3 + 0.92 X4 subject to: (yr. 2002) 0.05 X1 + 0.04 X2 + X3 = 20 + C1 (yr. 2003) 0.05 X1 + 1.04 X2 + X4+ 1.01 C1 = 30 + C2 (yr. 2004) 1.05 X1 + 1.01 C2 = 40 + C3 (Non-neg.) Xi 0, i = 1, 2, 3. (Non-neg.) Ci 0, i = 1, 2, 3. • The cash constraints can be visualized as “flow-balance equations” at each time period: Cash Cash Cash from from from bonds1 bonds2 bonds3 C1C2C3 Year 1 Year 2 Year 3 20 30 40
Project-Funding Optimized Spreadsheet Objective Function =SUMPRODUCT(C6:F6,C7:F7) • Decision variables: Located in cells C6:F6. • Cell D17 contains the value 0, since there is no surplus cash from the previous year. A B C D E F G H PROJFUND.XLS Project Funding Spreadsheet 1 2 Total cost......................………….. 83.20 Reinvestment rate..................................… 1.01 3 Decision Variables 4 Bond 1 Bond 2 Bond 3 Bond 4 5 # to purchase (in millions) 38.10 0.00 18.10 28.10 6 Bond price 1.04 1.00 0.98 0.92 7 8 Year Cash flow per bond 9 2002 0.05 0.04 1 0 10 2003 0.05 1.04 0 1 11 2004 1.05 0 0 0 12 13 Cash Reinvest Cash Surplus 14 from + cash prev = Req'mnt + cash =C17+D17-E17 15 Year bonds year 16 0 2002 20.00 20.00 0.00 17 2003 30.00 0.00 30.00 0.00 18 2004 40.00 0.00 40.00 0.00 19 =SUMPRODUCT($C$6:$F$6,C10:F10) =$G$3*F17
Project-Funding Optimal Solution • Bond 1 Bond 2 Bond 3 Bond 4 Bond price: 1.04 1.00 0.98 0.92 Number to purchase (in millions): 38.10 0.00 18.10 28.10 Total cost: $83.20 million. Note: Ci = 0, for i = 1, 2, 3, i.e., there is no surplus cash in any year. • What is the added cost (today, in 2001) of an increase in $1 million in the cash requirements a year from now (in 2002)? In 2003? In 2004? • These are the discount rates over time. • To determine these discount rates, we will need to solve a number of new problems where we increase, one by one, the requirement in each of the years. • This can be done in a clever way using SolverTable. Determining Discount Rates over Time using SolverTable
Determining Discount Rates over Time A B C D E F G PROJFUND-with-ST.XLS Project Funding Spreadsheet 1 2 Total cost......................... 83.20 Reinvestment rate............. 1.01 3 4 Bond 1 Bond 2 Bond 3 Bond 4 5 # to purchase (in millions) 38.10 0.00 18.10 28.10 6 Bond price 1.04 1.00 0.98 0.92 7 8 Year Cash flow per bond 9 2002 0.05 0.04 1 0 10 2003 0.05 1.04 0 1 11 2004 1.05 0 0 0 12 13 Cash Reinvest Cash Surplus 14 =20+IF($A$17=B17,1,0) from + cash prev = Req'mnt + cash 15 current year Year bonds year 16 2001 2002 20.00 0.00 20 0.00 17 2003 30.00 0.00 30 0.00 18 2004 40.00 0.00 40 0.00 19 =30+IF($A$17=B18,1,0) Input Cell =40+IF($A$17=B19,1,0) The trick: The IF() statements will add $1 to the requirement of the “current year” entered in Input Cell A17.
SolverTable Parameters • In SolverTable, make a Oneway table. Enter the following parameters: • The input cell (A17) will vary from 2001 to 2004, in increments of 1 year. We record the total cost and the optimal portfolio of bonds in the space below the current model. • The IF() statements in E17:E19 will correctly add $1 to the requirement in the “current year” (entered in input cell A17).
SolverTable Output and Discount Rates • The output from SolverTable as well as the calculations of the discount rates and the yield are: • The discount rates over time are: Present Value of additional $1 Yield • $1 in year 2002: $0.98 2.04% • $1 in year 2003: $0.92 4.26% • $1 in year 2004: $0.90 3.57% A B C D E F G H I J K Present value 21 of additional $1 Yield 22 $C$3 $C$6 $D$6 $E$6 $F$6 23 2001 83.20 38.10 0.00 18.10 28.10 $0.98 2.04% 24 2002 84.18 38.10 0.00 19.10 28.10 $0.92 4.26% 25 2003 84.12 38.10 0.00 18.10 29.10 $0.90 3.57% 26 2004 84.10 39.05 0.00 18.05 28.05 27 =B24-$B$23 Optimal Portfolio of Bonds Optimal Cost =H24^(1/($A$23-A24))-1
Cash-Flow-Matching Linear Programs The project funding LP is one example of a cash-flow-matchingLP, also called an asset-liability-matching LP. The bonds purchased are assets and the project requirements are liabilities. The cash-flow-matching linear program is one approach to problems in asset-liability management. Related applications are: • Pension planning • Pension-fund assets are short term • Pension liabilities are long term • Determine the least-cost portfolio of bonds purchased today that can guarantee funding of future liabilities • Municipal-bond issuance • Bonds issued are liabilities (long term) • Cash is raised today (short term) • Determine the maximum amount of funds that can be raised today given forecasts of future tax collections
Cash-Flow-Matching LPs (continued) • Yield-curve estimation • Can generate discount factors over time • Corporate debt defeasance • Bonds purchased today can be used to remove long-term liabilities from corporate balance sheets • Cash-flow-matching LPs have been used on Wall Street to buy and sell (issue) trillions of dollars of government, corporate, and municipal bonds.
For next class • Read Chapter 6.1 and 6.6 in the W&A text. • Read pp. 375-376 and 382-384 in the W&A text. • Optional reading: “Improving Gasoline Blending at Texaco.”