Download
1 / 33
330 likes | 383 Views
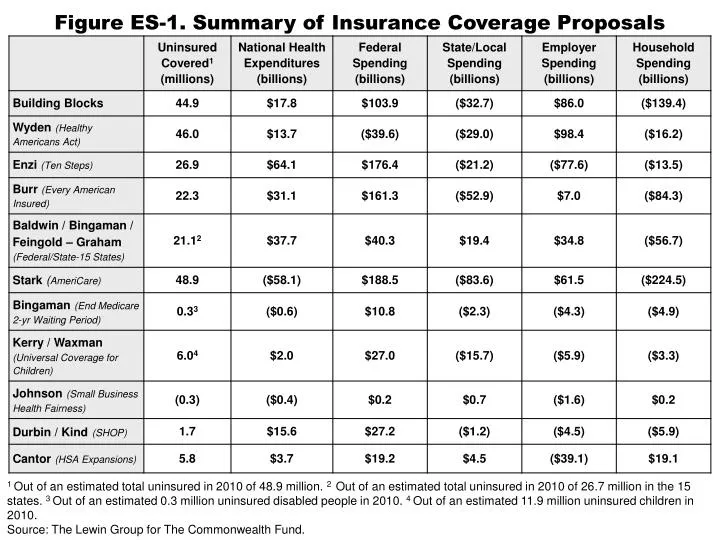
Figure ES-1. Summary of Insurance Coverage Proposals.

E N D
Figure ES-1. Summary of Insurance Coverage Proposals 1 Out of an estimated total uninsured in 2010 of 48.9 million. 2 Out of an estimated total uninsured in 2010 of 26.7 million in the 15 states. 3 Out of an estimated 0.3 million uninsured disabled people in 2010. 4 Out of an estimated 11.9 million uninsured children in 2010. Source: The Lewin Group for The Commonwealth Fund.
Figure ES-2. Number of Uninsured People Newly Covered,in 2010 (millions) Stark (AmeriCare) Wyden (Healthy Americans) Building Blocks Enzi (Ten Steps) Burr (Every American Insured) Baldwin/Bingaman/Feingold – Graham (Federal / State Partnership-15 States) Kerry / Waxman (Universal Coverage for Children) Cantor (HSA Expansions) Durbin / Kind (SHOP) Bingaman (End Medicare Waiting Period) Johnson (Small Business Health Fairness) Note: Out of an estimated total uninsured in 2010 of 48.9 million. Source: The Lewin Group for The Commonwealth Fund.
Figure ES-3. Change in Federal Spending, in 2010 (billions) Stark (AmeriCare) Enzi (Ten Steps) Burr (Every American Insured) Building Blocks Baldwin/Bingaman/Feingold – Graham (Federal / State Partnership-15 States) Durbin / Kind (SHOP ) Kerry / Waxman (Universal Coverage for Children) Cantor (HSA Expansion) Bingaman (End Medicare Waiting Period) Johnson (Small Business Health Fairness) Wyden (Healthy Americans) Source: The Lewin Group for The Commonwealth Fund.
Figure ES-4. Change in National Health Expenditures, in 2010 (billions) Enzi (Ten Steps) Baldwin/Bingaman/Feingold – Graham (Federal / State Partnership-15 States) Burr (Every American Insured) Building Blocks Durbin / Kind (SHOP) Wyden (Healthy Americans) Cantor (HSA Expansions) Kerry / Waxman (Universal Coverage for Children) Johnson (Small Business Health Fairness) Bingaman (End Medicare Waiting Period) Stark (AmeriCare) Source: The Lewin Group for The Commonwealth Fund.
Figure 1. Features of Mixed Private–Public Reform Proposals Source: Commonwealth Fund analysis of health reform proposals.
Figure 2. Major Features of Health Insurance Expansion Bills and Impact on Uninsured, National Expenditures 1Out of an estimated total uninsured in 2010 of 48.9 million. 2Out of an estimated total uninsured in 2010 of 26.7 million in the 15 states. Note: Wyden’s proposal is the Healthy Americans Act (S.334); Enzi’s proposal is Ten Steps (S.1783); Burr’s proposal is the Every American Insured Act (S.1886); Bingaman/Baldwin/Feingold/Graham’s proposals is Federal/State Partnership Act (S. 325, H.R.506, S.1169); and Stark’s proposal is AmeriCare (H.R.1841). Source: The Lewin Group for The Commonwealth Fund.
Medicaid/SCHIP 45.3 (15%) Uninsured 4.0 (1%) Dual Eligible 8.0 (3%) Uninsured 2.9 (1%) Medicare 30.9 (10%) Employer 161.5 (53%) Employer 150.4 (49%) Dual Eligible 8.4 (3%) Uninsured 48.9 (16%) TRICARE 6.0 (2%) HAA 252.8 (82%) Medicare 32.1 (10%) Employer 6.3 (2%) Medicaid/SCHIP 37.3 (12%) TRICARE 5.9 (2%) Dual Eligible 8.0 (3%) Connector 59.4 (19%) Medicare 30.9 (10%) Private Non-employer 1.4 (<1%) Private Non-employer 14.3 (5%) TRICARE 6.0 (2%) Uninsured 26.6 (9%) Uninsured 22.0 (7%) Dual Eligible 8.0 (3%) Medicare 30.9 (10%) Medicare 30.9 (10%) Employer Coverage 156.9 (51%) Employer 146.1 (48%) Medicaid/ SCHIP 32.7 (11%) TRICARE 6.0 (2%) Dual Eligible 8.0 (3%) Employer 2.1 (1%) Dual Eligible 8.0 (3%) Medicaid/ SCHIP 38.0 (12%) Medicare 30.9 (10%) TRICARE 6.0 (2%) TRICARE 6.0 (2%) AmeriCare 259.9 (85%) Private Non-Employer 61.1 (20%) Private Non-Employer 40.4 (13%) Figure 3. U.S. Population by Primary Source of Insurance, Under Current Law and Proposals, 2010 Current Law (millions) Building Blocks (millions) Wyden (millions) Stark (millions) Enzi (millions) Burr (millions) Total Population = 306.9 million Source: The Lewin Group for The Commonwealth Fund.
Figure 4. Health Insurance Expansion Bills Change in Health Spending by Stakeholder Group, Billions of Dollars, 2010 1Out of an estimated total uninsured in 2010 of 48.9 million. 2Out of an estimated total uninsured in 2010 of 26.7 million in the 15 states. Note: Wyden’s proposal is the Healthy Americans Act (S.334); Enzi’s proposal is Ten Steps (S.1783); Burr’s proposal is the Every American Insured Act (S.1886); Bingaman/Baldwin/Feingold/Graham’s proposal is Federal/State Partnership Act (S. 325, H.R.506, S.1169); and Stark’s proposal is AmeriCare (H.R.1841). Source: The Lewin Group for The Commonwealth Fund.
Figure 5. Changes in National Health Spending Under the Building Blocks Proposal in 2010 (in billions) Note: DSH = disproportionate-share hospital. 1 Provider assessment of 4% of hospital gross revenues and 2% of physician revenues. This amount is counted as a reduction in provider revenue. 2 Assumes 40% of change in provider payment rates is passed on to health plans. 3 Impact of Connector Plan on Private Insurance Market. Assumes 8% reduction for people remaining in the privately insured market who are not currently in an HMO. 4 Assumes IRS budget increased by 25% for income eligibility determination. Source: The Lewin Group for The Commonwealth Fund.
Figure 6. Change in Federal Health Expenditures Under Wyden’s Healthy Americans Act in 2010 (in billions) Increase in Federal Spending Before Offset Offsets and Revenues Net Change in Federal Spending Source: The Lewin Group for The Commonwealth Fund.
Figure 7. Change in Average Family Health Spending by Income Group Under Wyden’s Healthy Americans Act in 2010 Family Income Less than $10,000- $20,000- $30,000- $40,000- $50,000- $75,000- $100,000- $150,000 $10,000 $19,000 $29,999 $39,999 $49,999 $74,999 $99,999 $149,999 & Over Source: The Lewin Group for The Commonwealth Fund.
Figure 8. Changes in National Health Spending Under Wyden’s Healthy Americans Act in 2010 (in billions) Source: The Lewin Group for The Commonwealth Fund.
Figure 9. Changes in National Health Spending Under Enzi’sTen Steps to Transform Health Care Act in 2010 (in billions) 1 Includes increased payment rates for people previously covered under Medicaid, who take the buy-out and purchase private insurance. 2 Assumes 40% of change in provider payments are passed on to health plans. 3 Proposal appropriates $139 million in 2008 and 1009 to increase rate of HIT adoption. We estimate this results in net health system savings of $1.2 billion over 10 years. 4Assumes IRS budget is increased by 25% to administer tax credits and subsidies. Source: The Lewin Group for The Commonwealth Fund.
Figure 10. Change in Federal Health Expenditures Under Enzi’s Ten Steps to Transform Health Care Act in 2010 (in billions) Increase in Federal Spending Before Offset Offsets and Revenues Net Change in Federal Spending Source: The Lewin Group for The Commonwealth Fund.
Figure 11. Changes in National Health Spending Under Burr’s Every American Insured Act in 2010 (in billions) 1 Assumes 40% of change in provider payments are passed on to health plans. Source: The Lewin Group for The Commonwealth Fund.
Figure 12. Change in Federal Health Expenditures Under Burr’s Every American Insured Act in 2010 (in billions) Increase in Federal Spending Before Offset Offsets and Revenues Net Change in Federal Spending Source: The Lewin Group for The Commonwealth Fund.
Figure 13. Distribution of People by Primary Source of Insurance, Under Current Law and Sens. Bingaman, Feingold, Graham and Rep. Baldwin’s Proposals (Federal-State Partnership Acts), 2010: For the 15 Affected States Only (millions) Proposal (millions) Current Law (millions) Employer Coverage 81.6 (52%) Uninsured 26.7 (17%) Connector 21.9 (14%) Employer Coverage 73.9 (47%) Uninsured 5.6 (4%) Medicare (incl dual eligibles) 18.8 (12%) Medicare (incl dual eligibles) 18.8 (12%) Medicaid/ SCHIP 20.7 (13%) Medicaid/ SCHIP 30.7 (19%) TRICARE 3.0 (2%) Private Non-Employer 4.1 (3%) Private Non-Employer 7.2 (5%) TRICARE 3.0 (2%) Total Population = 158.0 million Source: The Lewin Group for The Commonwealth Fund.
Figure 14. Changes in Statewide Health Spending Under Baldwin / Bingaman / Feingold – Graham’s Federal-State Partnership Acts in 2010: For 15 Affected States Only (billions) 1 Assumes 40% of change in provider payments are passed on to health plans. 2 Assumes purchasing pool administrative costs of 4.5 percent of claims in the pool. 3 Assumes eligibility determination expense of $190 per application. Assumes federal match on eligibility determination for parents in the Connector. Source: The Lewin Group for The Commonwealth Fund.
Figure 15. Changes in National Health Spending Under Stark’s AmeriCare Health Act in 2010 (in billions) 1Assumes 40% of change in provider payment rates is passed on to health plans. 2Assumes eligibility determination expense of $171 per application, which is based upon the average cost of eligibility determination programs in New York. Source: The Lewin Group for The Commonwealth Fund.
Figure 16. Major Features of Health Insurance Expansion Bills and Impact on Uninsured, National Expenditures 1Out of an estimated total uninsured in 2010 of 48.9 million. Note: Bingaman & Green’s proposal is the Ending Medicare Waiting Period Act (S.2102); Kerry & Waxman’s proposal is the Kids Come First Act (S.95, H.R.1111). Source: The Lewin Group for The Commonwealth Fund.
Figure 17. Disabled People in the Medicare Waiting Period in 2010, by Source of Coverage Uninsured 299,2001 (19%) Medicaid 421,600 (26%) Non-Group 154,700 (10%) TRICARE 119,800 (7%) Employer 621,400 (38%) Total people currently in waiting period2 = 1,616,700 Note: Number of people in the waiting period was estimated using an analysis of 2005 through 2007 Current Population Survey data for non-workers receiving Social Security income and who do not have Medicare. 1Other studies have estimated 25 percent to 33 percent of people in the waiting period as being uninsured (Riley, G. 2006. Health Insurance and Access to Care among Social Security Disabled Insurance Beneficiaries during the Medicare Waiting Period. Inquiry, 43: 222-230; Berg Dale, S and Verdier, JM, 2003). 2We assume that the number of people in the waiting period remains unchanged between January 2008 and January 2010. Source: The Lewin Group for The Commonwealth Fund.
Figure 18. Health Insurance Expansion Bills Change in Health Spending by Stakeholder Group, Billions of Dollars, 2010 1Out of an estimated total uninsured in 2010 of 48.9 million. Note: Bingaman & Green’s proposal is the Ending Medicare Waiting Period Act (S.2102); Kerry & Waxman’s proposal is the Kids Come First Act (S.95, H.R.1111). Source: The Lewin Group for The Commonwealth Fund.
Figure 19. Poverty Distribution of Uninsured Children Under Age 21 Under Current Law, by Poverty Level, in 2010 (in thousands) Below Poverty 3,094 (26%) 300% FPL And Over 3,473 (29%) 200%– 299% FPL 2,261 (19%) 100%– 149% FPL 1,526 (13%) 150%–199% FPL 1,580 (13%) All uninsured children under age 21 (under current law, in thousands): 11,934 Source: The Lewin Group for The Commonwealth Fund.
Figure 20. Estimated Effect of Sen. Kerry’s and Rep. Waxman’s Proposal (Kids Come First Act) on Uninsured Children in 2010 (in thousands) Over 300% FPL 2,058 (17%) Private Coverage 1,415 (12%) Eligible for Expansions 1,887 (16%) Remain Uninsured 5,899 (50%) Covered Under New Program 6,032 (51%) Eligible Medicaid/ SCHIP 1,296 (11%) Medicaid and SCHIP expansions 4,617 (39%) Undocumented 660 (6%) All uninsured children under age 21 (current law, in thousands): 11,934 Note: Numbers may not sum to 100% due to rounding. Source: The Lewin Group for The Commonwealth Fund.
Figure 21. Major Features of Health Insurance Expansion Bills and Impact on Uninsured, National Expenditures 1Out of an estimated total uninsured in 2010 of 48.9 million. 2Modeling assumed that firms with under 100 employees are eligible; reinsurance of 90% of costs over $50,000. Note: Johnson’s proposal is the Small Business Health Fairness Act (H.R. 241); Durbin & Kind’s proposal is the SHOP Act (S.2795, H.R.6210); Cantor’s proposal is HSA Improvement, Expansion (H.R.3234). Source: The Lewin Group for The Commonwealth Fund.
Figure 22. Summary Impact of Rep. Johnson’s Proposal (Small Business Health Fairness Act), in 20101 1 Estimates show changes in coverage resulting from premium changes with and without the premium effects of the exemption from mandatory benefits. 2 The shift of older and sicker people from employer coverage to non-group market would increase premiums in the non-group market resulting in some loss of coverage. Source: The Lewin Group for The Commonwealth Fund.
Figure 23. Health Insurance Expansion BillsChange in Health Spending by Stakeholder Group, Billions of Dollars, 2010 1Out of an estimated total uninsured in 2010 of 48.9 million. 2Modeling assumed that firms with under 100 employees are eligible; reinsurance of 90% of costs over $50,000. Note: Johnson’s proposal is the Small Business Health Fairness Act (H.R. 241); Durbin & Kind’s proposal is the SHOP Act (S.2795, H.R.6210); Cantor’s proposal is HSA Improvement, Expansion (H.R.3234). Source: The Lewin Group for The Commonwealth Fund.
Figure 24. Changes in National Health SpendingUnder Durbin and Kind’s SHOP Act, in 2010 (billions) 1 Assumes 40% of change in provider payments are passed on to health plans. 2 Assumes purchasing pool administrative costs of 4.5 percent of claims in the pool. Source: The Lewin Group for The Commonwealth Fund.
Figure 25. Changes in National Health SpendingUnder Rep. Cantor’s HSA Improvement and Expansion Actin 2010 (in billions) 1 The HSA model creates incentives for enrollees to conserve on their expenditures for health care. Based upon a review of the literature on HSAs, we assume a savings of 4 percent for people newly enrolled in an HSA. 2 Assumes 40% of change in provider payments are passed on to health plans. Source: The Lewin Group for The Commonwealth Fund.
Figure 26. Summary of Insurance Coverage Proposals 1 Out of an estimated total uninsured in 2010 of 48.9 million. 2 Out of an estimated total uninsured in 2010 of 26.7 million in the 15 states. 3 Out of an estimated 0.3 million uninsured disabled people in 2010. 4 Out of an estimated 11.9 million uninsured children in 2010. Source: The Lewin Group for The Commonwealth Fund.
Figure 27. Number of Uninsured People Newly Covered, in 2010 (millions) Stark (AmeriCare) Wyden (Healthy Americans) Building Blocks Enzi (Ten Steps) Burr (Every American Insured) Baldwin/Bingaman/Feingold – Graham (Federal / State Partnership-15 States) Kerry / Waxman (Universal Coverage for Children) Cantor (HSA Expansions) Durbin / Kind (SHOP) Bingaman (End Medicare Waiting Period) Johnson (Small Business Health Fairness) Note: Out of an estimated total uninsured in 2010 of 48.9 million. Source: The Lewin Group for The Commonwealth Fund.
Figure 28. Change in Federal Spending, in 2010 (billions) Stark (AmeriCare) Enzi (Ten Steps) Burr (Every American Insured) Building Blocks Baldwin/Bingaman/Feingold – Graham (Federal / State Partnership-15 States) Durbin / Kind (SHOP ) Kerry / Waxman (Universal Coverage for Children) Cantor (HSA Expansion) Bingaman (End Medicare Waiting Period) Johnson (Small Business Health Fairness) Wyden (Healthy Americans) Source: The Lewin Group for The Commonwealth Fund.
Figure 29. Change in National Health Expenditures, in 2010 (billions) Enzi (Ten Steps) Baldwin/Bingaman/Feingold – Graham (Federal / State Partnership-15 States) Burr (Every American Insured) Building Blocks Durbin / Kind (SHOP) Wyden (Healthy Americans) Cantor (HSA Expansions) Kerry / Waxman (Universal Coverage for Children) Johnson (Small Business Health Fairness) Bingaman (End Medicare Waiting Period) Stark (AmeriCare) Source: The Lewin Group for The Commonwealth Fund.