Download
1 / 42
420 likes | 550 Views
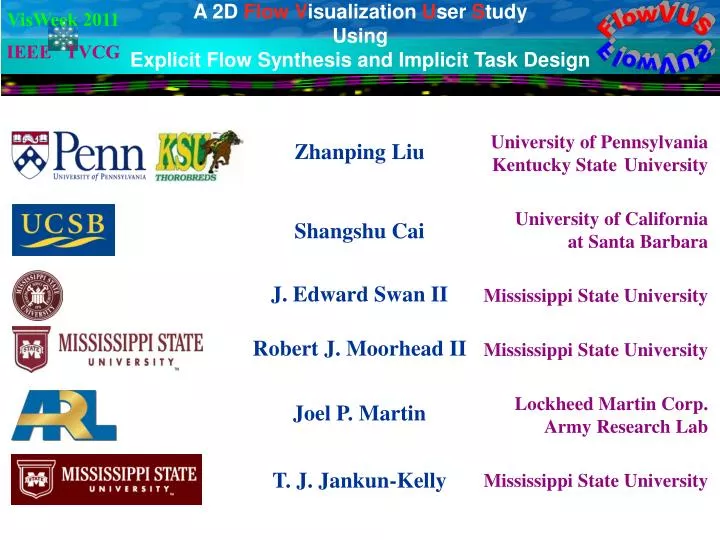
A 2D Flow V isualization U ser S tudy Using Explicit Flow Synthesis and Implicit Task Design. FlowVUS. FlowVUS. VisWeek 2011. IEEE TVCG. University of Pennsylvania Kentucky State University University of California at Santa Barbara Mississippi State University

E N D
A 2D FlowVisualization User Study Using Explicit Flow Synthesis and Implicit Task Design FlowVUS FlowVUS VisWeek 2011 IEEE TVCG University of Pennsylvania Kentucky State University University of California at Santa Barbara Mississippi State University Mississippi State University Lockheed Martin Corp. Army Research Lab Mississippi State University Zhanping Liu Shangshu Cai J. Edward Swan II Robert J. Moorhead II Joel P. Martin T. J. Jankun-Kelly
Brief Introduction Experimental Components • Synthetic Flow Datasets • Flow Visualization Techniques • Flow Analysis Tasks Test Strategy Test Results Concluding Remarks VIS 2011 FlowVUS Outline Explicit Flow Synthesis Diverse Evaluation Aspects Implicit Task Design
Brief Introduction • Flow Representation • Geometry-based / glyph-based • Texture-based / image-based VIS 2011 FlowVUS • arrow plots, streamlines, pathlines, streak lines, time lines stream ribbons, stream tubes, streamsurfaces, streak surfaces, …… • graphical primitives rendered for a sparse or discrete representation • good survey by McLoughlin et al (EuroGraphics 09) • topology-based methods use graphical primitives for a representation • spot noise, LIC, UFLIC, LEA, IBFV, IBFVS, ISA, UFAC, …… • texture convolution / advection for a dense continuous representation • good survey by Laramee et al (Computer Graphics Forum 04)
Brief Introduction • Flow Visualization User Study • NIH-NSF report on Visualization Research Challenges (Johnson etc 06) • different techniques may be advantageousin different aspects • only a few have been evaluated to determine their effectiveness • the best methods might not have been integrated into vis. systems • domain scientists may not yet have access to cutting-edge techniques • insufficient user feedback for visualization researchers and developers VIS 2011 FlowVUS more user studies are needed to examineflowrepresentations improve existingtechniques design innovative techniques bridge the long-lasting gaps between research,development, and deployment
Brief Introduction VIS 2011 FlowVUS • Flow Visualization User Study • Previous work • 2D flow visualization user study (Laidlaw et al, TVCG 05) • 3D flow visualization user study (Forsberg et al, TVCG 09) • …… • insufficient research on effective user study methodologies
Brief Introduction given a user study framework or platform for evaluating flow visualization techniques distorted by various bias issues the data collected and the analysis results are distorted too, failing to provide objectiveconclusions flow visualization techniques VIS 2011 FlowVUS • Flow Visualization User Study • Previous work
Brief Introduction VIS 2011 FlowVUS • Flow Visualization User Study • Previous work • 2D flow visualization user study (Laidlaw et al, TVCG 05) • 3D flow visualization user study (Forsberg et al, TVCG 09) • …… • insufficient research on effective user study methodologies • There is more to a flow visualization user study than • the scenarios being considered • the techniques being evaluated • the flow features being examined • the specific yet usually ad-hoc conclusions being drawn e.g., surface flows, volume flows, time-varying flows, …… e.g., UFLIC, LEA, IBFV, IBFVS, ISA, UFAC, …… e.g., separation, attachment, vortex core, periodic orbit, ……
Brief Introduction VIS 2011 FlowVUS • Flow Visualization User Study Conducting objective 2D flowvisualizationuser studies even with traditional and well-known techniques • remains an open problem • requires valid methodologies — an anti-bias platform • refines our understanding of some 2D flow vis. techniques • offers quantitative support forqualitative evidence or anecdotal advice in terms of the effectiveness of flow vis. techniques • helps formulate a general framework that is necessary for carrying out convincing flow visualization user studies with more complex configurations
Brief Introduction flow databias explicit flow synthesis task design bias implicit task design VIS 2011 FlowVUS • Our 2D Flow Visualization User Study — FlowVUS • motivated by the necessity for and significance of effective flow visualization user study methodologies • builds on Laidlaw et al’s work • features new strategies and important improvements
Brief Introduction given a user study framework or platform for evaluating flow visualization techniques the data collected and the analysis resultsare convincing,leading to a better understanding oftechniques equipped with anti-bias methodologies flow visualization techniques VIS 2011 FlowVUS • Our 2D Flow Visualization User Study — FlowVUS
Brief Introduction • Major contributions • explicit flow synthesis combats data-relatedbias by automatically generating many flows withsimilar topological complexities but with different structures • implicit task design reduces task-related biasbydesigning sample-free pattern-based flow analysis tasks that require thorough investigation of the flow direction VIS 2011 FlowVUS • Our 2D Flow Visualization User Study — FlowVUS • diverse evaluation perspectives involve representation continuity, visual intuition, image contrast, and color mapping when selecting a set of representative vis. techniques • hybrid timing strategy uses two timing schemes (fixed duration / variable duration) to help reveal subtle differences in vis. effectiveness between techniques • refined statistical analysis processes outliers + Ryan REGWQpost-hoc homogeneous subset tests
Experimental Components Synthetic Flow Datasets Flow Visualization Techniques Synthetic Flow Datasets Flow Analysis Tasks Flow Analysis Tasks Flow Visualization Techniques VIS 2011 FlowVUS • 2D Flow Visualization User Study Pipeline three fundamental components of a typical flow vis. user study
Experimental Components • A single dataset would introduce learning effect — unacceptable • Multiple datasets may incur data-dependent bias (inflow complexity) • Data-dependent bias can be suppressed toan acceptable degree by synthesizing flows withsimilar topological complexities • Synthetic datasets are used for user study inmedical imaging VIS 2011 FlowVUS • Synthetic Flow Datasets • Previous work on flow vis. user study usesimplicit flow synthesis implicit flow synthesis • samples randomly selected andthe associated vectorsrandomly assigned • a flow field is generated by vector interpolation between the samples • the topology of the resulting flow is unpredictable — number of critical points, the locations, the types &overall complexity
Experimental Components Explicit Flow Synthesis • employs parameterized placement and configuration of critical points • provides great flexibility and control in creating pseudo flow fields • Basis Vector Field (BVF) flow synthesis method by van Wijk (TOG 02) — a BVF is governed by a critical point with some parameters — the entire flow results from the combination of multiple BVFs • a survey and initialization-analysis-editing by Zhang et al (TOG 06) • FlowVUS BVF • FlowVUSis the first user study to value and apply explicit flow synthesis • based on BVF forfast automatic generation of many synthetic flows VIS 2011 FlowVUS • Synthetic Flow Datasets • centers and foci—Explicitly Specified Critical Points (ESCPs) • saddles — derived from the interaction among centers and foci • uses a force composition-attenuation method to govern the influence ofan ESCP(with rotational force and radial force) or a BVF on an arbitrary point
Experimental Components VIS 2011 FlowVUS • Synthetic Flow Datasets
Experimental Components • ESCP parameters • location • radial force • rotational force • forceattenuation • sink / source type • clockwise / counter-clockwise orientation • Layouttemplates • to synthesize flowswith diverse structures yet with a relatively balanced layout of a fixed number of ESCPs + a slightly varying number of saddles — to maintain nearly the same topological complexity between many flows 4 pairs of y-symmetric ESCP placement blocks 4 pairs of center-symmetric ESCP placement blocks 4 pairs of x-symmetric ESCP placement blocks blue block: for primary ESCP placement; gray block: for mirror ESCP placement VIS 2011 FlowVUS • Synthetic Flow Datasets • to generate x- / y- / center-symmetric and dubiously asymmetric flows — so as to support our pattern-based implicit flow analysistask design • a primary ESCP is randomly placed & configured in each blue block and its mirrorESCP is placed based on a symmetry type yet with the sink / source type & clockwise/counter-clockwise orientationpossibly different — they may begeometrically symmetric but topologically asymmetric
Experimental Components asymmetricx-symmetricasymmetric center-symmetricasymmetricy-symmetric VIS 2011 FlowVUS • Synthetic Flow Datasets symmetric flows versus asymmetric flows
Experimental Components • Primitive flow characteristics • direction — the positive and negative directionstangent to the flow • orientation— the positive direction of the flow only (e.g.,oriented LIC) • velocity magnitude— a scalar quantity many flow features (e.g., critical points)visually recognizablefrom them • The most important • a vector quantity providing the fundamental info that distinguishes a flow field from a scalar field and hence governs why / how flow visualization differs very much from scalarvisualization in the working mechanism • how well a flow vis.technique delineates the general, directional info largelydetermines its effectiveness in conveying specificflow features • An informal classification • Direct Feature-Extraction Based (DFEB) — e.g., topology extraction • Indirect User-Exploration Based (IUEB)— e.g., flow lines and LIC VIS 2011 FlowVUS • Flow Visualization Techniques — direction fromthe flow reconstruction or visual analysis perspective our focus
Experimental Components • IUEB techniques • need more user studies than DFEB techniques do due to the human factors user exploration visual analysismental reconstruction • 54 candidates — 3 families hedgehogsstreamlines LIC • 7 techniques • selected through a thorough intra- and inter-family investigation • representative of many geometry-based and texture-based techniques in terms of the aforementioned four major visual / evaluation aspects • configured via iterative internal tests for optimal visualization results VIS 2011 FlowVUS • Flow Visualization Techniques — FlowVUS evaluation aspects • involve several major visual factors representation continuity (e.g., 0D / 1.5D / 2D)visual intuition image contrast color mapping
ArrowCM ArrowCW StreamCM Experimental Components OrientedLIC StreamCW BasicLIC EnhancedLIC VIS 2011 FlowVUS • Flow Visualization Techniques
Experimental Components • Some essential points • impossible & unnecessary to enumerate specific / complex flow features and then design many flow analysis tasks (how many studies are enough?) VIS 2011 FlowVUS • Flow Analysis Tasks • the performance of an average participant in visualflow analysis is expected to reflect the effectiveness of the IUEB technique (being used) in conveying the flow direction — the general fundamental information • flow analysis tasks in a user study are not necessarily real or practical • flow analysis tasks are the way instead of (or at least more than) the goal for example, synthetic tasks are often used for psychological user studies by devising someseemingly irrelevant yet intrinsically coupled questions • in order to reduce task-related bias, flow analysis tasks may take an indirect / implicit way and a testable form (— do not directly ask the user to check the flow direction at a point) (— questions are easy to understandbut challenging to answer correctly)
Experimental Components • Explicit sample-based tasks • used in previous work and susceptible to bias • a typical example — directly ask to check the flow directionat a point the participant is shown a randomly placed circle(of which the center is hence a random sample) and asked toclick on the point along the circle that a particle advected from the center is to hit Implicit pattern-based tasks • a methodologyadvocated and formulated in this paper to suppress bias • use a simple form but indirectly require thorough investigation of the flow VIS 2011 FlowVUS • Flow Analysis Tasks the complexity of a flow usually varies with the location more difficult to do this task in turbulent areas than in laminar areas the selection ofthe circle’s radius may further compound this issue mouse pointing & clicking, irrelevant of judgment, affect the test result • critical point recognition— detect patterns globally/across the whole domain • critical point classification— match patterns locally/around an area of interest
Experimental Components • using specific real tasks about well-known flow features critical point recognition (CPR)critical point classification (CPC) involving in-depth flow structures identification of separatrices identification of periodic orbits VIS 2011 FlowVUS • Flow Analysis Tasks • Implicit task design • creating general synthetic tasks to reduce data-related bias resulting from flow sampling and mouse point-and-click operations to relieve non-expert participants from understanding complex, possibly domain-specific details in the form of easy-to-understandyetdifficult-to-answer questions requiring intensive analysis of flow directions such as symmetric pattern categorization (SPC) — to examine the flow direction both globally and locally — to check the entire pattern: x-/y-/z-/center-symmetric or asymmetric
Experimental Components • Very challenging synthetic tasks • two or three critical points (centers, foci, and saddles) combined with a variety of configurations to define some Composite Templates (CTs) CT-based CPR-like pattern recognition CT-based CPC-like pattern classification • The selected implicit tasks • CPR + CPC + SPC • integration of 2 real tasks and 1 synthetic task todemonstrate the types • the balance between the overall challenge degree and the test duration — some synthetic tasks mentioned above would require more test time VIS 2011 FlowVUS • Flow Analysis Tasks • checking if flow A and flow B have a CT pattern in common • judging if flow A is a rotational version of flow B • determining if flow A is exactly part of flow B
Test Strategy • 7M images • generated using the selected 7 techniques to visualize M synthetic flows • involving N x-symmetric, N y-symmetric, N center-symmetric, and optionally N asymmetric flows — M = 3N or 4N (e.g., N = 30) depending on theexpected complexity and time duration of the test • Ground truth—one record per synthetic flow • symmetry type of the overall pattern • the location and type of every ESCP (center / focus) from the synthesizer • the location of every derived saddle from Newton-Raphson root-finding VIS 2011 FlowVUS • The Input • Task Session • 1 CPR task (recognizing ALL critical points from an image) or • <= 30 CPC tasks or • <= 30 (without asymmetric flows)/ 40 (with asymmetric flows) SPC tasks
Test Strategy • 1 session = 1 CPR task or (<= 30) CPC tasks or (<= 30/40) SPC tasks • 1 set = (1 CPR session + 1 CPC session + 1 SPC session) for one technique • 1 cycle = 7 sets (one for each technique) • 1 test = 3 cycles VIS 2011 FlowVUS • Task Management = 21 sets = 63 sessions for each participant • use 7 techniques thrice to produce7 × 3 = 21 images (for 21 randomly- selected flows),with 1 imagefor each CPC session (3 per technique) • use each technique to produce 30 images(for 30 randomly-selected flows), with 1 randomly-selected critical point marked per image(with 10 marked for each critical point type: center, focus, saddle),for each CPC session • use each technique to visualize 30 or 40 randomly-selected flows (creating 10 images for each symmetry / asymmetric type)for each SPCsession 21 CPR sessions + 21 CPC sessions + 21 SPC sessions = 63 sessions • with a bank of images pre-generated for one time, 63 sessions are created using TestGen upon each test and are then delivered in random order
Test Strategy • Effectiveness metrics • the effectiveness of a visualization technique is usually reflected by answer correctness and response time • a more effective technique allows the user to get a correct answer faster • given a fixed amount of time, more correct answers tend toresult from a more effective technique thanfrom a less effective technique this hybrid timing strategy helps reveal the subtle differences in visualization effectiveness that may exist between techniques • Variable-duration session • mouse click positions and response timeare recorded for a session • flow analysis (for recognizing a single critical point)is relatively quick • the answeris precision-critical (despite a considerable error tolerance) seeks to “curb” the participant from hastiness and excessive inaccuracy • Fixed-duration session • as many tasks as possible are presented to theparticipant one by one in a fixed amount of time (30s) andradio-button choices are recorded • flow analysis is relatively slow and judgment-intensive intended to “push” the participant to accomplish more tasks VIS 2011 FlowVUS • Hybrid Timing — for CPR — for CPC & SPC (response time on average)
Test Strategy VIS 2011 FlowVUS CPR — Critical Point Recognition
Test Strategy VIS 2011 FlowVUS CPC — Critical Point Classification
Test Strategy VIS 2011 FlowVUS SPC — Symmetric Pattern Categorization
Test Results VIS 2011 FlowVUS • Basic Facts • 4 CFD experts + 16 graduate students in science & engineering • expert and non-expert participants were not compared herein • 5079 CPR trials + 7467 CPC trials + 4948 SPR trials wererecorded • the absolute differences inresponse time for CPR / CPC / SPC turned out to be small, regardless of the statistical differences • a higher priority assigned to correctness than to response speed to provide correctness-over-response-sorting (CORS)when evaluating the seven techniquesin the overall visualization effectiveness • Processing Outliers • theresponse time and the (CPR) location error each showed a skewed normal distribution in terms of the histogram • outliers weredetermined case by case by investigating the tails of the distributions and noting values after conspicuous gaps • each outlier was replaced with the median of the cell’s responses
Test Results • Statistical Analysis • Chi-square tests and ANOVA (univariate analysis of variance) • calculating post-hoc homogeneous subsets using Ryan REGWQ tests mean time (in seconds) to recognize a critical point (5079 trials, F(6,115.3) = 19.9, p < 0.001) means with the same letter are not significantly different at p 0.05 (Ryan REGWQ post-hoc hst) VIS 2011 FlowVUS • FlowVUS Results • CPR (Critical Point Recognition) — response time
Test Results 336 errors, χ2(6) = 132, p < 0.001 CORS sorting by CPR effectiveness in decreasing order EnhancedLIC - StreamCM - BasicLIC - OrientedLIC - StreamCW - ArrowCM - ArrowCW VIS 2011 FlowVUS • FlowVUS Results • CPR (Critical Point Recognition) — answer incorrectness
Test Results mean time (in seconds) to classify a critical point (7467 trials, F(6,116.2) = 30.9, p < 0.001) means with the same letter are not significantly different at p 0.05 (Ryan REGWQ post-hoc hst) VIS 2011 FlowVUS • FlowVUS Results • CPC (Critical Point Classification) — response time
Test Results 753 errors, χ2(6) = 772, p < 0.001 CORS sorting by CPC effectiveness in decreasing order EnhancedLIC - StreamCW - StreamCM - BasicLIC - OrientedLIC - ArrowCW - ArrowCM VIS 2011 FlowVUS • FlowVUS Results • CPC (Critical Point Classification) — answer incorrectness
Test Results mean time (in sec.s) to categorize a symmetric pattern (4948 trials, F(6,123.1) = 8.74, p < 0.001) means with the same letter are not significantly different at p 0.05 (Ryan REGWQ post-hoc hst) VIS 2011 FlowVUS • FlowVUS Results • SPC (Symmetric Pattern Categorization) — response time
Test Results 323 errors, χ2(6) = 70.1, p < 0.001 CORS sorting by SPC effectiveness in decreasing order EnhancedLIC - StreamCM - BasicLIC - OrientedLIC - StreamCW – ArrowCM - ArrowCW VIS 2011 FlowVUS • FlowVUS Results • SPC (Symmetric Pattern Categorization) — answer incorrectness
Test Results • color mapping has a considerable influence on a geometry-basedflow representation VIS 2011 FlowVUS • a texture-based dense representation with accentuated flow streaks (EnhancedLIC) enables intuitive perception of the flow • a geometry-based integral representation with uniform density control (StreamCM or • StreamCW) exploits visual interpolation to facilitate mental reconstruction of the flow
Concluding Remarks — to reduce data-relatedbias — tosuppresstask-related bias • Explicit flow synthesis • Implicit task design • Two important methodologies / conceptsproposed as part of our anti-bias framework forconducting objective flow vis. user studies VIS 2011 FlowVUS • Key Points — to reduce data-relatedbias template-based parameterized placement & configuration of critical points automatic synthesis of diverse flows withsimilar topological complexities — tosuppresstask-related bias pattern-based (real tasks + synthetic tasks)the way more than the goal — representative techniques representation continuity visual intuition image contrast color mapping variable-duration session fixed-duration session to reveal the subtle differences in vis. effectiveness between techniques processes outliers + RyanREGWQpost-hoc homogeneous subset tests • Explicit flow synthesis • Implicit task design • Diverse evaluation perspectives • Hybrid timing strategy • Refined statistical analysis
Concluding Remarks VIS 2011 FlowVUS • Limitations & Lessons • FlowVUS is bias-resistant but not bias-free • Varying a-priori familiarity with techniques • Varying a-priori familiarity with flow features • Real flowsneeded for introducing techniques • Careneeded for predicting the time duration biasis pervasive throughout the whole pipeline of a user study and hence we cannot totally eliminate it whilewe need to reduce it— cannot let it be some participants were not familiar with the LICs upon the training session more user studies are needed to disseminate the latest vis. techniques care needs to be taken when evaluatingmore sophisticated / current ones some participants needed extra help withsome features during the training session many challenges facing an evaluation involving more complex features synthetic flowsare needed for formal tests whilereal flows(particularly with contextual boundaries) are needed, besides real flows, for the training session
Concluding Remarks controversial view • Evaluation aspects — representative visualization techniques • neither possible nor necessary to evaluate every existing vis. technique controversial view • provide general guidelines for visualizationresearch (algorithm design) • Interesting topics • user studies on streamline placement algorithms • user studies on surfaceflow visualization techniques • user studies on volume flow visualization techniques VIS 2011 FlowVUS • Future Plans • Anti-bias methodologies • user studies might otherwise be non-convincing & even worse misleading • probably one way to help you judgebetween 2 contradicting conclusions • as of nowmore important than scenarios, techniques, features, conclusions • require much research (e.g., explicit flow synthesis & implicit task design) — to adopt the conclusions of a user study without necessary anti-bias methods? end usersmight not care about the underlying working mechanism they are interestedin the resulting images and the associated visual aspects(such as image contrast, color map, intuition, continuity,etc)
Thank you for your time and attention!