Download
1 / 32
320 likes | 509 Views
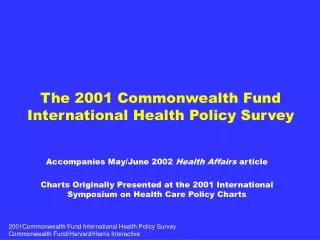
The 2001 Commonwealth Fund International Health Policy Survey. Accompanies May/June 2002 Health Affairs article Charts Originally Presented at the 2001 International Symposium on Health Care Policy Charts. 2001 International Health Policy Survey.

E N D
The 2001 Commonwealth Fund International Health Policy Survey Accompanies May/June 2002 Health Affairs article Charts Originally Presented at the 2001 International Symposium on Health Care Policy Charts
2001 International Health Policy Survey • Topics: System Views; Access, Quality and Cost; Worries About the Future -- By Income and Trends • Survey of 1,400 adults in each of five countries, Australia, Canada, New Zealand, United Kingdom and United States • Conducted by Harris Interactive and subcontractors from April 23, 2001 to May 31, 2001. • Low income defined as adults reporting incomes “below” or “much below” average (median) national income. • Margin of error + or - 3 percentage points for differences between countries and + or - 2% for country averages
Views of Health Care System in Five Nations - 1988-2001 x 1988 data not available. *Harvard/Harris/Baxter, 1988. **1998 Commonwealth Fund International Health Policy Survey.
Percent Who Believe that Adults with Low Incomes Have More Problems Getting Care than Those with Higher Incomes Percent
Views of Change in Own and Family’s Access to Care 2001 Percent
Same Day Access to Doctors Percent of patients able to get same day appointment when sick
Extremely or Very Difficult to See A Specialist When Needed, by Income Percent
Did Not Get a Recommended Test, Treatment or Follow-up Due to Cost, by Income Percent
Did Not Get Needed Dental Care Due to Cost, by Income Percent
Waited Less Than One Month for Elective or Non-Emergency Surgery Base: Those with elective surgery in the past 2 years Percent 1998 Commonwealth Fund International Health Policy Survey and
Waited Four Months or More for Elective or Non-Emergency Surgery Base: Those with elective surgery in the past 2 years Percent 1998 Commonwealth Fund International Health Policy Survey and
Hospital Care Quality Concerns, 2001 Base: Hospitalized in Past Two Years
Received Conflicting Information fromDifferent Health Professionals When Sick Base: Adults with a serious illness, injury, or disability in past 2 years Percent “often” or “sometimes” received conflicting information
Composite Physician Ratings Percent rating physicians excellent or very good on six measures of responsiveness *Average excellent or very good rating of: treating you with dignity & respect, listening carefully, being accessible by phone or in person, spending enough time, knowing you, and providing you with all the information you want.
Composite Rating of Physicians, by Income Percent rating physicians excellent or very good on six measures* *Average excellent or very good rating of: treating you with dignity & respect, listening carefully, being accessible by phone or in person, spending enough time, knowing you, and providing you with all the information you want.
Rated Overall Medical Care Received in the Past 12 Months as Excellent or Very Good Percent 1998 Commonwealth Fund International Health Policy Survey and
Did Not Fill A Prescription Due To Cost In Past Year, 1998 and 2001 Percent 1998 Commonwealth Fund International Health Policy Survey and
Did Not Fill a Prescription Due to Cost in Past Year, by Income Percent
Total Out of Pocket Costs, 2001 Percent
Had Problems Paying Medical Bills In Past Year, 2001 Percent
Had Problems Paying Medical Bills in the Past Year, By Income Percent
Composite of “Very Worried” About Future Ability to Get Care, by Income Percent they are very worried on a series of measures* *Country averages of percent very worried: they would not be able to get the most advanced care if seriously ill, would not be able to afford treatment if seriously ill, would not be able to pay for long term care or would wait too long for non-emergency care.
Methodology Surveys of nationally representative, non-institutionalized adult populations in each of the five countries were conducted by telephone during April-May 2001 by Harris Interactive and their international affiliates. Interviews resulted in a sample of 1412 adults in Australia, 1400 in Canada, 1400 in New Zealand, 1400 in the United Kingdom, and 1401 in the United States. Identical instruments were used in all of the countries. The surveys were designed by a team of researchers at the Harvard School of Public Health and the Commonwealth Fund and reviewed by experts in each country.