Download
1 / 24
240 likes | 365 Views
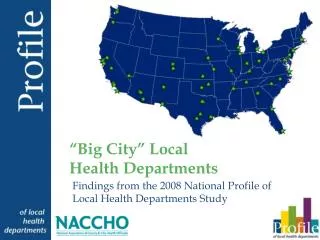
Pictures of Local Health Departments: Findings from the 2005 National Profile of Local Health Departments Study. December 8, 2006 Carolyn Leep, NACCHO. 2005 National Profile of Local Health Departments Study. Collaboration with CDC Fourth in the Profile series

E N D
Pictures of Local Health Departments:Findings from the 2005 National Profile of Local Health Departments Study December 8, 2006 Carolyn Leep, NACCHO
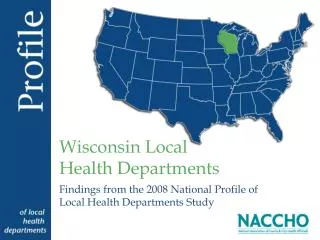
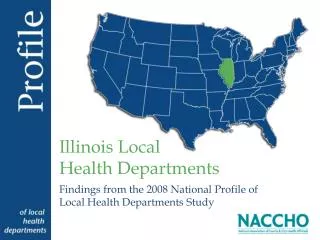
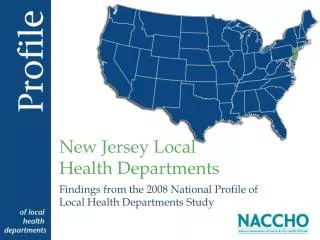
2005 National Profile of Local Health Departments Study • Collaboration with CDC • Fourth in the Profile series • Prior studies in 1989, 1992-3, and 1996-7 • Census design – includes all LHDs in U.S. • First National Profile to be conducted as Web-based survey • Source of all data in this presentation
LHDs Included in the 2005 National Profile Study (by State and Type of Governance)
Mean Percentage of LHD Revenues from Selected Sources (by Type of Governance)
Median Per Capita LHD Revenues: Federal Pass-Through Sources (by State)
Typical Staffing Patterns for LHDs Serving Jurisdictions of Various Population Sizes
Other Facts about LHDs • The percentage of LHDs providing clinical services has decreased greatly over the past decade. • 51% of LHDs have completed a community health assessment in the last three years • Over 90% of LHDs partner with schools, emergency responders, media, physicians, and community organizations • 70% of LHDs have a Web site
Carolyn LeepSenior AnalystNational Association of County & City Health Officialscleep@naccho.org