Download
1 / 61
620 likes | 786 Views
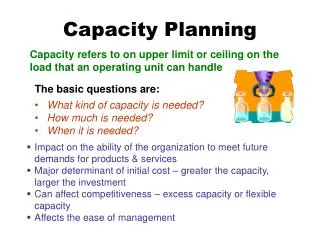
POWER. Carbon-Aware Energy Capacity Planning for Datacenters. Chuangang Ren, Di Wang , Bhuvan Urgaonkar , Anand Sivasubramaniam Computer Science and Engineering The Pennsylvania State University Aug. 9 th , 2012. Energy Consumption of Datacenters.

E N D
POWER Carbon-Aware Energy Capacity Planning for Datacenters Chuangang Ren, Di Wang, BhuvanUrgaonkar, AnandSivasubramaniam Computer Science and Engineering The Pennsylvania State University Aug. 9th, 2012
Energy Consumption of Datacenters • Increase in number/size of datacenters due to heavy reliance on Internet services • Datacenters, if treated as a country, fifth in the world for electricity use • Datacenter electricity usage expected to double in next 5 years and requires 12 new power plants Environmental Cost Economic Cost
Electricity Cost of Datacenters Electricity Cost for Datacenters (billion US $) Year Sources: Koomey 2011 and IDC 2009
Monthly Costs of a 10MW Datacenter Other Utility Bill 8% Servers 24% Power Infrastructure 30.5% Chart: Source: Book by Barroso et al., Assumption: 20,000 servers, 1.5 PUE, 15$/W Cap-ex, Duke Energy Op-ex, 4yr server & 12 yr infrastructure amortization (Tier-2) 37.5% All cost are amortized at a monthly granularity 4
Monthly Costs of a 10 MW Datacenter Peak power draw Other 8% Utility Bill 24% Power draw (W) Servers Energyconsumption (area under this curve) 30.5% Power Infrastructure Month 37.5% Chart: Source: Book by Barroso et al., Assumption: 20,000 servers, 1.5 PUE, 15$/W Cap-ex, Duke Energy Op-ex, 4yr server & 12 yr infrastructure amortization (Tier-2) All cost are amortized at a monthly granularity
Environmental Cost of Datacenters CO2 Emission by Country in 2007 (megatons CO2 per year) Trend: Cap the carbon footprint of large electricity consumers (including datacenters) Regulations: • Emission Capping and Trading Schemes (e.g. cap-and trade) • Carbon Tax • Penalties if one fails to comply with the carbon regulations 340 178 146 142 80 Datacenter 2020 Datacenter 2007 Sources: Mckinsey on Business Technology 2008
Ways to Reduce Datacenter CO2 Emissions • Power demand reduction • Numerous endeavors on energy-proportional computing technologies • Smart cooling system control
Ways to Reduce Datacenter CO2 Emissions • Power demand reduction • Numerous endeavors on energy-proportional computing technologies • Smart cooling system control • Renewable energy penetration • Oklahoma Wind to Power Google Data Center • Facebook’s solar-powered datacenter
Poor Renewable Usage by Datacenters Today Sources: Greenpeace International 2012
Ways to Reduce Datacenter CO2 Emissions • Power demand reduction • Numerous endeavors on energy-proportional computing technologies • Smart cooling system control • Renewable energy penetration • Oklahoma Wind to Power Google Data Center • On-site solar based renewable generation at Google’s headquarter • Smarter electricity sourcing strategies
Datacenter Power Sourcing Off-site Utility Energy Grid On-site Datacenter
Datacenter Power Sourcing Off-site Utility Energy Grid On-site Diesel Generator Datacenter
Datacenter Power Sourcing Off-site Utility Energy Grid On-site Diesel Generator Datacenter
On-site Renewable Generation + Negligible transmission and distribution loss + Power peak shaving + Tolerate grid outage - Real-estate concerns may limit its efficacy - Not necessarily the best location with the right renewable energy potential (low kWh/sq) Off-site Utility Energy Grid On-site Diesel Generator On-site Renewable Datacenter
Off-site Renewable Generation Off-site Renewable Off-site Utility Energy Grid On-site Banking Fee $ $ Wheeling Fee Diesel Generator On-site Renewable Datacenter
Off-site Renewable Generation Off-site Renewable + Good renewable energy potential (higher kWh/sq) + Grid reduces intermittency of renewable energy • Transmission losses • Wheeling and banking charges Off-site Utility Energy Grid On-site Banking Fee $ Wheeling Fee $ Diesel Generator On-site Renewable Datacenter
Renewable Energy Products Renewable Energy Products Off-site Renewable Off-site Utility Energy Grid On-site Diesel Generator On-site Renewable Datacenter
Renewable Energy Products • Power Purchase Agreement (PPA): • A long-term contract to buy electricity output from a renewable energy provider, e.g., Google, Microsoft. • Giving renewable power project developers the access to financing they need to build new projects that contribute to new green power to the grid
Renewable Energy Products Off-site Renewable Renewable Energy Products Carbon Offsetting Market Off-site Utility Energy Grid On-site Diesel Generator On-site Renewable Datacenter
Renewable Energy Certificate (REC) • A REC is a certificate that represents 1 MWh of electricity generated from renewable energy • Two products: commodity electricity and REC • REC can be sold or traded separately from commodity electricity + REC
Datacenter Power Sourcing Renewable Energy Products Carbon Offsetting Market Off-site • Expensive + Eliminate the need of capex and opex investment + Immunity to the renewable intermittency Utility Energy Off-site Renewable On-site Grid On-site Renewable Diesel Generator Datacenter
Question Given all renewable energy options, how to achieve a target carbon footprint at minimal cost?
Talk Outline Motivation 1 • Renewable Power Sources 2 • Framework for Provisioning 3 Evaluation 4 Conclusions 5
Methodology Renewable Energy Products Carbon Offsetting Market Max. Demand () Off-site Utility Energy On-site Grid Powercap () Power (W) Time t=10min
Peak Power Impact on Utility Bill 15-min Peak power draw 12 $/KW Average draw Power draw (W) Peak to Average ratio 3:1 5 c/KWh Energyconsumption (area under this curve) Month Duke Utility Tariffs (12 $/KW, 5 c/KWh) Note: Tariff rates collected from Duke Energy Utility.
Methodology Renewable Energy Products Carbon Offsetting Market Max. Demand () Off-site Utility Energy On-site Grid Powercap () Power (W) Time t=10min
Methodology Renewable Energy Products Carbon Offsetting Market Max. Demand () Off-site Utility Energy On-site Grid Powercap () Power (W) Time t=10min
Methodology Renewable Energy Products Carbon Offsetting Market Max. Demand () Off-site Utility Energy On-site Grid Powercap () Power (W) Time t=10min
Optimization Problem: Objective • Minimize: • UtilityBill + OnSiteCost + OffSiteCost + MarketCost + ESD Cost + DGOpEx
Optimization Problem: Constraints Renewable Energy Products Carbon Offsetting Market Off-site Utility Energy On-site Grid Power sourcing:
Optimization Problem: Constraints Off-site Off-site On-site On-site Max. Demand () Powercap () Power (W) Time On-site Constraints t=10min (1) Peak power cap:
Optimization Problem: Constraints Off-site Off-site On-site On-site On-site Constraints (1) Peak power cap: (2) On-site renewable availability:
Optimization Problem: Constraints Renewable Energy Products Carbon Offsetting Market Grid Off-site On-site Off-site renewable availability:
Optimization Problem: Constraints Carbon Constraint 0% 50% 90%
Talk Outline Motivation 1 • Renewable Power Sources 2 • Framework for Provisioning 3 Evaluation 4 Conclusions 5
Renewable Trace Profiles On-site Off-site On/Off-site Source: NREL, Western Wind and Solar Integration Study
Datacenter Configuration: Baseline Off-site Utility Energy Grid On-site Datacenter
Datacenter Configuration: Base-DG Off-site Utility Energy Grid On-site Diesel Generator Datacenter
Datacenter Configuration: Base-DG-ESD Off-site Utility Energy Grid On-site ESD Diesel Generator Datacenter
Datacenter Configuration: All Renewable Energy Products Carbon Offsetting Market Off-site Utility Energy Off-site Renewable On-site Grid Diesel Generator On-site Renewable Datacenter
Datacenter Cost Optimization Facebook Datacenter Power Cost (No Carbon Requirement) 3761 3700 3678 3669 • On-site renewables help reduce peak power drawn, hence lower cost • On-site renewables can supplement ESD and DG in their role in peak reduction at a lower cost Total Cost per Day ($)
Impact of Carbon Target Facebook Datacenter Power Cost 3841 3700 3717 3682 3761 3669 Total Cost per Day ($) $ Carbon Reduction Goal (%) add baseline here
Impact of Carbon Target (cont.) • On-site only: Base-DG-ESD + on-site renewable generation • Off-site only: Base-DG-ESD + off-site renewable generation • Market only: Base-DG-ESD + REC/PPA 3 1 2 Total Cost per Day ($) Carbon Reduction Goal (%)
Impact of Carbon Target (cont.) • On-site only: Base-DG-ESD + on-site renewable generation • Off-site only: Base-DG-ESD + off-site renewable generation • Market only: Base-DG-ESD + REC/PPA • Hybrid solution as high carbon reduction increases • Renewable penetration goes beyond carbon offsetting, even lower cost 1 3 2
Concluding Remarks • Framework for energy capacity planning to achieve carbon footprints target at minimal cost • Key findings: • Renewable penetration lower carbon footprints and costs • On-site renewables helpful for peak power reduction • Hybrid solution depending on carbon footprint targets
Thank you! http://csl.cse.psu.edu/ Penn State University
Electricity Cost of Datacenters Other Power and Cooling Cost for Datacenters (billion US $) Utility Bill 8% Servers 24% Power Infrastructure 30.5% Chart: Source: Book by Barroso et al., Assumption: 20,000 servers, 1.5 PUE, 15$/W Cap-ex, Duke Energy Op-ex, 4yr server & 12 yr infrastructure amortization (Tier-2) Year 37.5% Sources: Koomey 2011 and IDC 2009